Estimated Value: $147,000 - $190,766
3
Beds
2
Baths
2,596
Sq Ft
$66/Sq Ft
Est. Value
About This Home
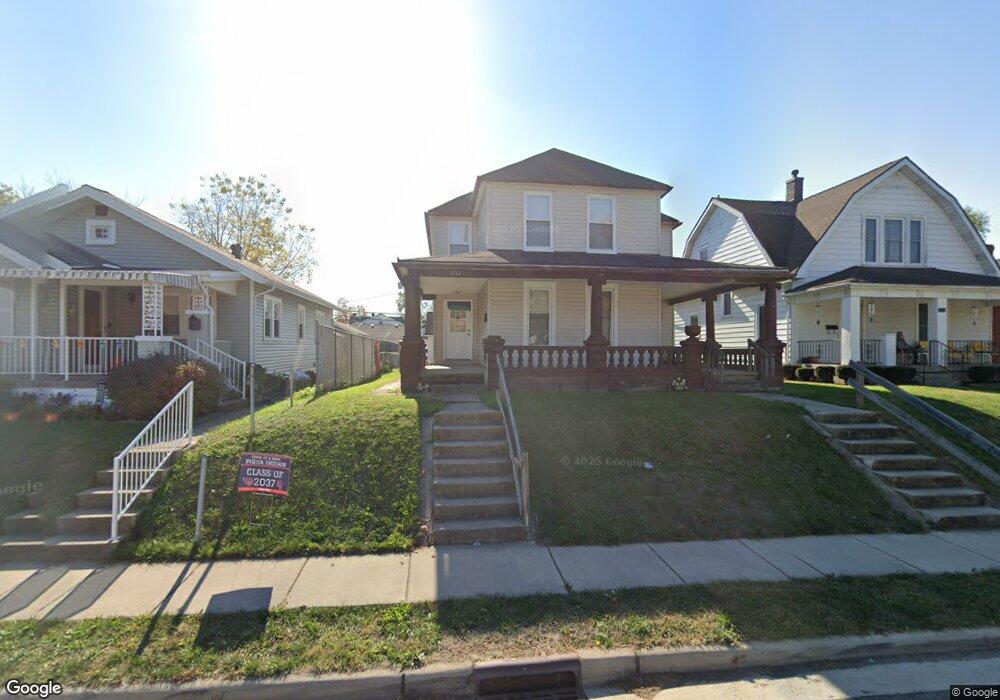
This home is located at 1712 Broadway, Piqua, OH 45356 and is currently estimated at $170,255, approximately $65 per square foot. 1712 Broadway is a home located in Miami County with nearby schools including Piqua Central Intermediate School, Springcreek Primary School, and Piqua Junior High School.
Ownership History
Date
Name
Owned For
Owner Type
Purchase Details
Closed on
Mar 20, 2014
Sold by
Peoples Federal Savings & Loan Associati
Bought by
Rowley Investments Llc
Current Estimated Value
Purchase Details
Closed on
May 17, 2012
Sold by
Carnes Mark D and Carnes Jennifer R
Bought by
Peoples Federal Savings & Loan Associati
Purchase Details
Closed on
Jun 19, 2006
Sold by
Hsbc Bank Usa
Bought by
Carnes Mark
Purchase Details
Closed on
Apr 20, 2006
Sold by
Roberts Jimmy E
Bought by
Hsbc Bank Usa
Purchase Details
Closed on
Jul 6, 1999
Sold by
Roberts Glen D and Roberts Shirley J
Bought by
Roberts Jimmy E and Roberts Terrie S
Home Financials for this Owner
Home Financials are based on the most recent Mortgage that was taken out on this home.
Original Mortgage
$83,313
Interest Rate
7.29%
Mortgage Type
FHA
Purchase Details
Closed on
Dec 11, 1998
Sold by
Wray Mary S
Bought by
Roberts Glen D and Roberts Shirley J
Purchase Details
Closed on
Apr 13, 1994
Bought by
Wray Mary S
Create a Home Valuation Report for This Property
The Home Valuation Report is an in-depth analysis detailing your home's value as well as a comparison with similar homes in the area
Home Values in the Area
Average Home Value in this Area
Purchase History
| Date | Buyer | Sale Price | Title Company |
|---|---|---|---|
| Rowley Investments Llc | $55,500 | Attorney | |
| Peoples Federal Savings & Loan Associati | -- | Attorney | |
| Carnes Mark | $45,000 | -- | |
| Hsbc Bank Usa | $70,000 | -- | |
| Roberts Jimmy E | $85,000 | -- | |
| Roberts Glen D | $70,000 | -- | |
| Wray Mary S | $68,800 | -- |
Source: Public Records
Mortgage History
| Date | Status | Borrower | Loan Amount |
|---|---|---|---|
| Previous Owner | Roberts Glen D | $83,313 |
Source: Public Records
Tax History Compared to Growth
Tax History
| Year | Tax Paid | Tax Assessment Tax Assessment Total Assessment is a certain percentage of the fair market value that is determined by local assessors to be the total taxable value of land and additions on the property. | Land | Improvement |
|---|---|---|---|---|
| 2024 | $1,895 | $44,950 | $8,440 | $36,510 |
| 2023 | $1,895 | $44,950 | $8,440 | $36,510 |
| 2022 | $1,928 | $44,950 | $8,440 | $36,510 |
| 2021 | $1,615 | $34,550 | $6,480 | $28,070 |
| 2020 | $1,588 | $34,550 | $6,480 | $28,070 |
| 2019 | $1,597 | $34,550 | $6,480 | $28,070 |
| 2018 | $1,336 | $27,550 | $6,720 | $20,830 |
| 2017 | $1,352 | $27,550 | $6,720 | $20,830 |
| 2016 | $1,338 | $27,550 | $6,720 | $20,830 |
| 2015 | $1,567 | $26,500 | $6,480 | $20,020 |
| 2014 | $1,567 | $26,500 | $6,480 | $20,020 |
| 2013 | $1,590 | $26,500 | $6,480 | $20,020 |
Source: Public Records
Map
Nearby Homes