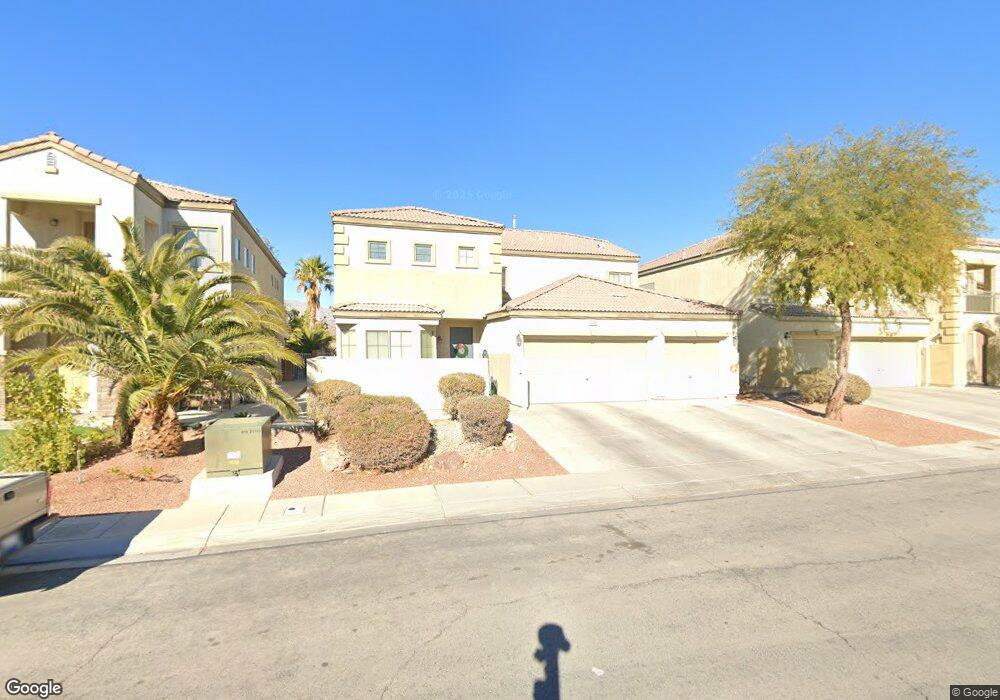
1712 Danielle Rebecca Ave North Las Vegas, NV 89086
Deer Springs NeighborhoodEstimated Value: $521,000 - $556,000
4
Beds
4
Baths
3,170
Sq Ft
$169/Sq Ft
Est. Value
About This Home
This home is located at 1712 Danielle Rebecca Ave, North Las Vegas, NV 89086 and is currently estimated at $535,103, approximately $168 per square foot. 1712 Danielle Rebecca Ave is a home located in Clark County with nearby schools including Don E. Hayden Elementary School, Ruby Duncan Elementary School, and Carroll M. Johnston STEM Academy of Environmental Studies.
Ownership History
Date
Name
Owned For
Owner Type
Purchase Details
Closed on
Feb 22, 2008
Sold by
Us Bank Na
Bought by
Demille Jason F and Demille Kellie E
Current Estimated Value
Home Financials for this Owner
Home Financials are based on the most recent Mortgage that was taken out on this home.
Original Mortgage
$247,500
Outstanding Balance
$152,736
Interest Rate
5.65%
Mortgage Type
Unknown
Estimated Equity
$382,367
Purchase Details
Closed on
Aug 16, 2007
Sold by
Veach Jonathan W
Bought by
Us Bank Na and Banc Of America Funding 2006-D Trust
Purchase Details
Closed on
Jan 18, 2006
Sold by
Centex Homes
Bought by
Veach Jonathan W
Home Financials for this Owner
Home Financials are based on the most recent Mortgage that was taken out on this home.
Original Mortgage
$355,700
Interest Rate
7.25%
Mortgage Type
Unknown
Create a Home Valuation Report for This Property
The Home Valuation Report is an in-depth analysis detailing your home's value as well as a comparison with similar homes in the area
Home Values in the Area
Average Home Value in this Area
Purchase History
| Date | Buyer | Sale Price | Title Company |
|---|---|---|---|
| Demille Jason F | $275,000 | First Amer Title Co Of Nv | |
| Us Bank Na | $386,132 | Fidelity National Title | |
| Veach Jonathan W | $444,643 | Commerce Title |
Source: Public Records
Mortgage History
| Date | Status | Borrower | Loan Amount |
|---|---|---|---|
| Open | Demille Jason F | $247,500 | |
| Previous Owner | Veach Jonathan W | $355,700 |
Source: Public Records
Tax History Compared to Growth
Tax History
| Year | Tax Paid | Tax Assessment Tax Assessment Total Assessment is a certain percentage of the fair market value that is determined by local assessors to be the total taxable value of land and additions on the property. | Land | Improvement |
|---|---|---|---|---|
| 2025 | $2,282 | $166,837 | $43,400 | $123,437 |
| 2024 | $2,216 | $166,837 | $43,400 | $123,437 |
| 2023 | $2,216 | $156,709 | $36,400 | $120,309 |
| 2022 | $2,152 | $141,434 | $32,200 | $109,234 |
| 2021 | $2,089 | $115,529 | $28,350 | $87,179 |
| 2020 | $2,026 | $112,565 | $28,350 | $84,215 |
| 2019 | $1,967 | $110,676 | $23,800 | $86,876 |
| 2018 | $1,909 | $94,208 | $21,000 | $73,208 |
| 2017 | $3,098 | $92,370 | $19,250 | $73,120 |
| 2016 | $1,809 | $80,325 | $14,700 | $65,625 |
| 2015 | $1,805 | $62,486 | $11,200 | $51,286 |
| 2014 | $1,752 | $55,263 | $9,450 | $45,813 |
Source: Public Records
Map
Nearby Homes
- 1417 Crystal Rainey Ave
- 1409 Crystal Rainey Ave
- 2114 Cold Canyon Ave
- 2113 Albury Ave
- 2047 Arrington Ave
- 1509 Peyton Stewart Ct
- 2211 Taylor Ranch Ave
- 6417 Gardella Ct
- 6839 Laguna Blanca St
- 6941 Toll Mountain St
- 2261 Cold Canyon Ave
- 6842 Laguna Blanca St
- 1804 Jake Andrew Ave
- 2114 Thelen Ave
- 6559 Summershade St
- 1129 Blissful Plains Ave
- 1130 Blissful Plains Ave
- 2379 Albury Ave
- 6955 Stone Cactus St
- 6519 Summershade St
- 1716 Danielle Rebecca Ave
- 1708 Danielle Rebecca Ave
- 1804 Danielle Rebecca Ave
- 1704 Danielle Rebecca Ave
- 1713 Danielle Rebecca Ave
- 1717 Danielle Rebecca Ave
- 1616 Danielle Rebecca Ave
- 1808 Danielle Rebecca Ave
- 1805 Danielle Rebecca Ave
- 1617 Danielle Rebecca Ave
- 1809 Danielle Rebecca Ave
- 1612 Danielle Rebecca Ave
- 1713 Roaring Cougar Ave
- 1812 Danielle Rebecca Ave
- 1709 Roaring Cougar Ave
- 1717 Roaring Cougar Ave
- 1705 Roaring Cougar Ave
- 1805 Roaring Cougar Ave
- 1613 Danielle Rebecca Ave
- 1617 Roaring Cougar Ave