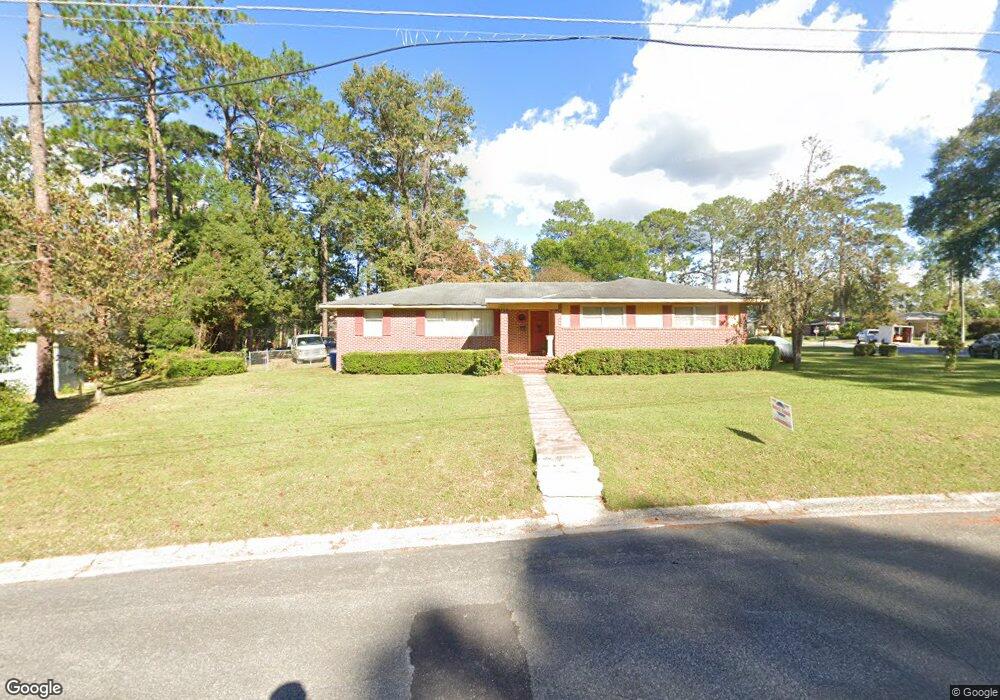
1712 Dean Dr Waycross, GA 31501
Estimated Value: $232,650 - $258,000
4
Beds
4
Baths
2,480
Sq Ft
$98/Sq Ft
Est. Value
About This Home
This home is located at 1712 Dean Dr, Waycross, GA 31501 and is currently estimated at $242,413, approximately $97 per square foot. 1712 Dean Dr is a home located in Ware County with nearby schools including Center Elementary School, Waycross Middle School, and Ware County High School.
Ownership History
Date
Name
Owned For
Owner Type
Purchase Details
Closed on
Jul 13, 2022
Sold by
Bussey Albert L
Bought by
Bussey Albert Lee and Bussey Crystal
Current Estimated Value
Home Financials for this Owner
Home Financials are based on the most recent Mortgage that was taken out on this home.
Original Mortgage
$120,065
Interest Rate
5.78%
Mortgage Type
FHA
Purchase Details
Closed on
Sep 30, 2011
Sold by
Toms Garvin M
Bought by
Bussey Albert L
Home Financials for this Owner
Home Financials are based on the most recent Mortgage that was taken out on this home.
Original Mortgage
$62,679
Interest Rate
4.26%
Mortgage Type
Purchase Money Mortgage
Purchase Details
Closed on
Sep 19, 2006
Sold by
Toms Floy Waggoner
Bought by
Long Ronald A
Purchase Details
Closed on
Oct 27, 1987
Create a Home Valuation Report for This Property
The Home Valuation Report is an in-depth analysis detailing your home's value as well as a comparison with similar homes in the area
Home Values in the Area
Average Home Value in this Area
Purchase History
| Date | Buyer | Sale Price | Title Company |
|---|---|---|---|
| Bussey Albert Lee | -- | -- | |
| Bussey Albert L | $63,500 | -- | |
| Long Ronald A | -- | -- | |
| -- | $56,500 | -- |
Source: Public Records
Mortgage History
| Date | Status | Borrower | Loan Amount |
|---|---|---|---|
| Previous Owner | Bussey Albert Lee | $120,065 | |
| Previous Owner | Bussey Albert L | $62,679 |
Source: Public Records
Tax History Compared to Growth
Tax History
| Year | Tax Paid | Tax Assessment Tax Assessment Total Assessment is a certain percentage of the fair market value that is determined by local assessors to be the total taxable value of land and additions on the property. | Land | Improvement |
|---|---|---|---|---|
| 2024 | $1,690 | $95,612 | $7,380 | $88,232 |
| 2023 | $1,725 | $67,322 | $5,118 | $62,204 |
| 2022 | $1,975 | $67,322 | $5,118 | $62,204 |
| 2021 | $2,074 | $52,800 | $5,118 | $47,682 |
| 2020 | $2,090 | $51,364 | $5,118 | $46,246 |
| 2019 | $1,762 | $41,314 | $5,118 | $36,196 |
| 2018 | $1,760 | $40,892 | $5,118 | $35,774 |
| 2017 | $1,718 | $40,892 | $5,118 | $35,774 |
| 2016 | $1,718 | $40,892 | $5,118 | $35,774 |
| 2015 | $1,063 | $40,891 | $5,118 | $35,774 |
| 2014 | $1,063 | $40,892 | $5,118 | $35,774 |
| 2013 | -- | $40,891 | $5,117 | $35,774 |
Source: Public Records
Map
Nearby Homes
- 1103 Kontz Ave
- 1715 City Blvd
- 1011 Cherokee Cir
- Lot 3 City Blvd
- 1002 Cherokee Cir
- 00 Seminole Trail
- 1703 Rainbow Dr
- 1621 Camellia Dr
- 2108 Screven Ave
- 1400 E Cherokee Dr
- 1206 Morningside Dr
- 1001 Coral Rd
- 1009 Euclid Ave
- 706 Cherokee Cir
- 907 Euclid Ave
- 1100 Euclid Ave
- 1502 Seminole Trail
- 1002 Baltimore Ave
- 1701 Satilla Blvd
- 1205 Dean Dr