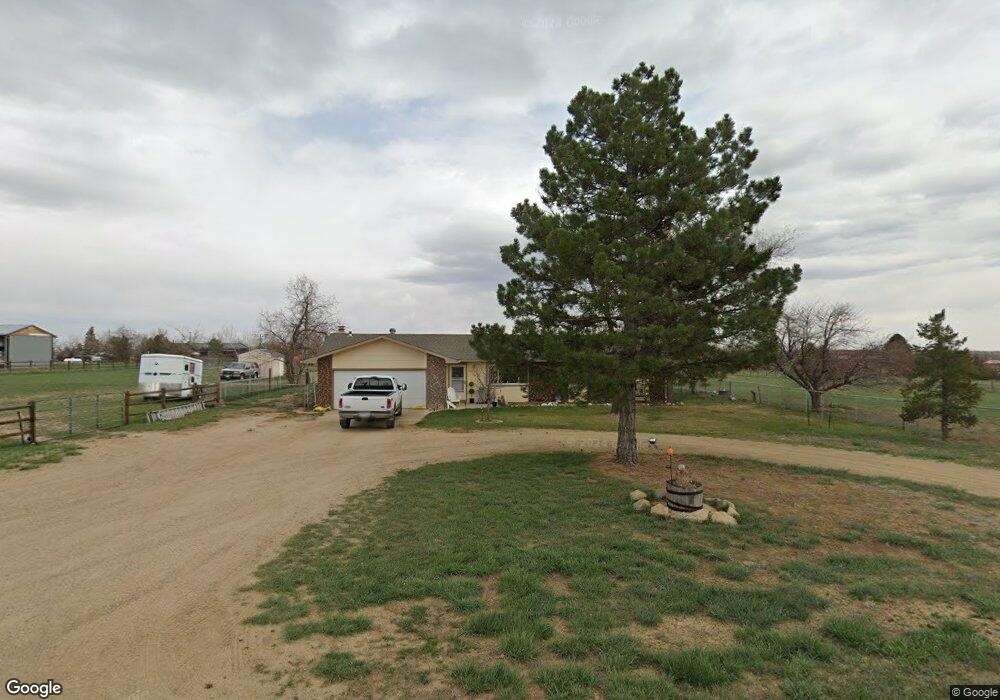
1712 Front Range Ave Berthoud, CO 80513
Estimated Value: $637,976 - $771,000
3
Beds
2
Baths
1,679
Sq Ft
$425/Sq Ft
Est. Value
About This Home
This home is located at 1712 Front Range Ave, Berthoud, CO 80513 and is currently estimated at $713,744, approximately $425 per square foot. 1712 Front Range Ave is a home located in Larimer County with nearby schools including Berthoud Elementary School, Turner Middle School, and Berthoud High School.
Ownership History
Date
Name
Owned For
Owner Type
Purchase Details
Closed on
May 7, 2008
Sold by
Oneill Daniel J
Bought by
Sheridan Caroline B
Current Estimated Value
Purchase Details
Closed on
Aug 27, 2004
Sold by
Coons Joseph S
Bought by
Oneil Daniel J and Sheridan Caroline B
Home Financials for this Owner
Home Financials are based on the most recent Mortgage that was taken out on this home.
Original Mortgage
$226,000
Interest Rate
5.97%
Mortgage Type
Purchase Money Mortgage
Purchase Details
Closed on
Mar 9, 1999
Sold by
Coons Carol A
Bought by
Coons Joseph S
Home Financials for this Owner
Home Financials are based on the most recent Mortgage that was taken out on this home.
Original Mortgage
$102,400
Interest Rate
6.74%
Purchase Details
Closed on
Nov 1, 1986
Bought by
Coons Joseph
Create a Home Valuation Report for This Property
The Home Valuation Report is an in-depth analysis detailing your home's value as well as a comparison with similar homes in the area
Purchase History
| Date | Buyer | Sale Price | Title Company |
|---|---|---|---|
| Sheridan Caroline B | -- | None Available | |
| Oneil Daniel J | $282,500 | -- | |
| Coons Joseph S | -- | -- | |
| Coons Joseph | $105,000 | -- |
Source: Public Records
Mortgage History
| Date | Status | Borrower | Loan Amount |
|---|---|---|---|
| Previous Owner | Oneil Daniel J | $226,000 | |
| Previous Owner | Coons Joseph S | $102,400 | |
| Closed | Oneil Daniel J | $42,300 |
Source: Public Records
Tax History
| Year | Tax Paid | Tax Assessment Tax Assessment Total Assessment is a certain percentage of the fair market value that is determined by local assessors to be the total taxable value of land and additions on the property. | Land | Improvement |
|---|---|---|---|---|
| 2025 | $3,612 | $43,444 | $11,338 | $32,106 |
| 2024 | $3,493 | $45,433 | $14,405 | $31,028 |
| 2022 | $2,831 | $32,818 | $13,900 | $18,918 |
| 2021 | $2,910 | $33,762 | $14,300 | $19,462 |
| 2020 | $2,501 | $29,015 | $14,300 | $14,715 |
| 2019 | $2,465 | $29,015 | $14,300 | $14,715 |
| 2018 | $2,287 | $25,718 | $6,120 | $19,598 |
| 2017 | $1,994 | $25,718 | $6,120 | $19,598 |
| 2016 | $2,038 | $25,488 | $6,766 | $18,722 |
| 2015 | $2,024 | $25,490 | $6,770 | $18,720 |
| 2014 | $1,850 | $22,210 | $5,410 | $16,800 |
Source: Public Records
Map
Nearby Homes
- 0 Beverly Dr
- 4808 Beverly Dr
- 4909 Gary Dr
- 0 Lucky Ln
- 5409 Gary Dr
- 5216 Glen Dr
- 5306 Foothills Dr
- 7380 W County Road 4
- 3704 W County Road 4
- 3312 Meining Rd
- 1525 S Co Road 27e
- 1785 Serene Place
- 0 Rodney Ln Unit 1030974
- 1796 Serene Place
- 0 W County Road 8e Unit RECIR1018960
- 3412 Erving Ct
- 871 N County Road 23e
- 3000 Sundown Dr
- 14754 Creekside Ln
- 867 Carvin Ct
- 5025 W County Road 4
- 1824 Taras Ct
- 5001 W County Road 4
- 1800 Front Range Ave
- 1900 Taras Ct
- 1801 Blue Mountain Ave
- 1900 Front Range Ave
- 6165 W County Road 4
- 5016 W County Road 4
- 1901 Taras Ct
- 4920 W County Road 4
- 4801 W County Road 4
- 1870 Sherlyn Ct
- 5050 W County Road 4
- 6204 W County Road 4
- 2005 Blue Mountain Ave
- 1924 Taras Ct
- 1713 Blue Mountain Ave
- 5054 W County Road 4
- 5050 Wagon Wheel Rd
Your Personal Tour Guide
Ask me questions while you tour the home.