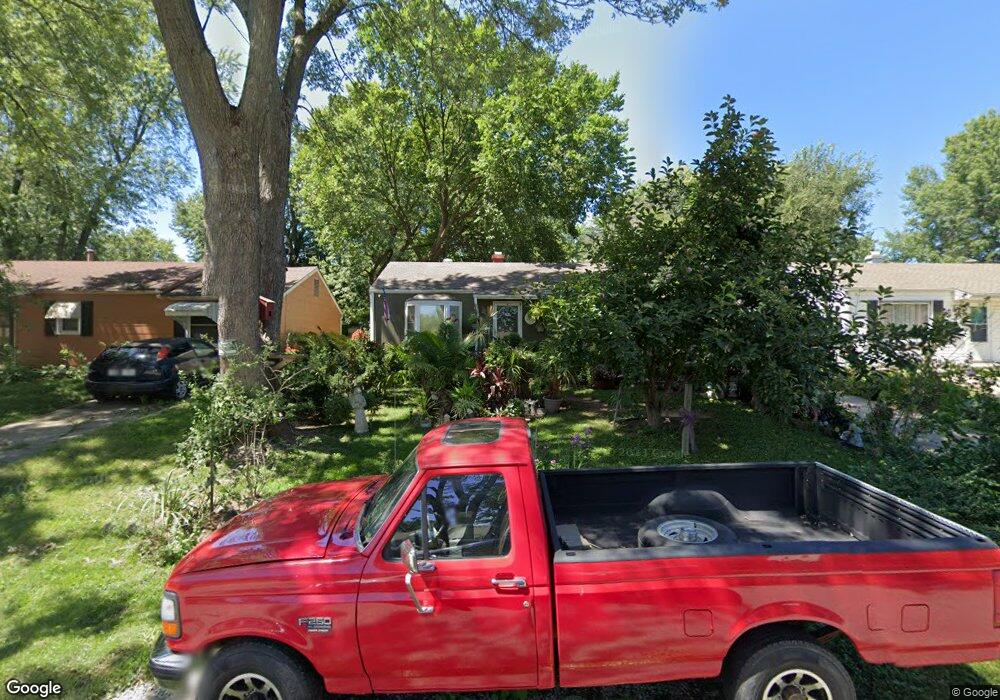
1712 N Dodgion St Independence, MO 64050
Ott-Chrisman NeighborhoodEstimated Value: $137,000 - $157,000
2
Beds
1
Bath
792
Sq Ft
$183/Sq Ft
Est. Value
About This Home
This home is located at 1712 N Dodgion St, Independence, MO 64050 and is currently estimated at $145,184, approximately $183 per square foot. 1712 N Dodgion St is a home located in Jackson County with nearby schools including Ott Elementary School, Bridger Middle School, and Bingham Middle School.
Ownership History
Date
Name
Owned For
Owner Type
Purchase Details
Closed on
Jul 29, 2011
Sold by
Barchak Richard and Barchak Colleen
Bought by
Bridges Ronald E and Barchak Bridges Leisa E
Current Estimated Value
Home Financials for this Owner
Home Financials are based on the most recent Mortgage that was taken out on this home.
Original Mortgage
$13,000
Outstanding Balance
$8,952
Interest Rate
4.53%
Mortgage Type
Credit Line Revolving
Estimated Equity
$136,232
Purchase Details
Closed on
Sep 18, 2008
Sold by
Hud
Bought by
Barchak Richard and Barchak Colleen
Purchase Details
Closed on
Mar 24, 2008
Sold by
Davidson Christina L and Davidson Jason B
Bought by
Hud
Purchase Details
Closed on
Jul 18, 2002
Sold by
Pace Michael W
Bought by
Pace Michael W and Pace Melissa
Home Financials for this Owner
Home Financials are based on the most recent Mortgage that was taken out on this home.
Original Mortgage
$22,000
Interest Rate
6.62%
Mortgage Type
Stand Alone Second
Create a Home Valuation Report for This Property
The Home Valuation Report is an in-depth analysis detailing your home's value as well as a comparison with similar homes in the area
Home Values in the Area
Average Home Value in this Area
Purchase History
| Date | Buyer | Sale Price | Title Company |
|---|---|---|---|
| Bridges Ronald E | -- | First American Title Ins Co | |
| Barchak Richard | -- | First American Title Co | |
| Hud | $76,505 | None Available | |
| Pace Michael W | -- | -- |
Source: Public Records
Mortgage History
| Date | Status | Borrower | Loan Amount |
|---|---|---|---|
| Open | Bridges Ronald E | $13,000 | |
| Previous Owner | Pace Michael W | $22,000 |
Source: Public Records
Tax History
| Year | Tax Paid | Tax Assessment Tax Assessment Total Assessment is a certain percentage of the fair market value that is determined by local assessors to be the total taxable value of land and additions on the property. | Land | Improvement |
|---|---|---|---|---|
| 2025 | $1,106 | $18,297 | $3,365 | $14,932 |
| 2024 | $1,081 | $15,962 | $3,483 | $12,479 |
| 2023 | $1,081 | $15,962 | $2,284 | $13,678 |
| 2022 | $1,067 | $14,440 | $1,733 | $12,707 |
| 2021 | $1,066 | $14,440 | $1,733 | $12,707 |
| 2020 | $1,039 | $13,677 | $1,733 | $11,944 |
| 2019 | $1,023 | $13,677 | $1,733 | $11,944 |
| 2018 | $932 | $11,904 | $1,509 | $10,395 |
| 2016 | $918 | $11,605 | $1,957 | $9,648 |
Source: Public Records
Map
Nearby Homes
- 1704 N Emery St
- 1608 N Liberty St
- 1504 N Emery St
- 1309 N Main St
- 13212 Kemper Ct
- 1204 E Salisbury Rd
- 711 W Jones St
- 1212 N Spring St
- 1315 N Mccoy St
- 1223 N Pleasant St
- 822 Dickinson Rd
- 1011 N Osage St
- 622 W Nickell Ave
- 2402 N Liberty St
- 802 W Jones St
- 303 W Marcia Ave
- 915 Dickinson Rd
- 1004 N Duvall Ave
- 300 N Holder Rd
- 222 W Mill St
- 1714 N Dodgion St
- 1710 N Dodgion St
- 1708 N Dodgion St
- 1716 N Dodgion St
- 1713 N Dodgion St
- 1718 N Dodgion St
- 1718 N Dodgion St
- 1706 N Dodgion St
- 1713 N High St
- 1711 N Dodgion St
- 1715 N Dodgion St
- 1715 N High St
- 1711 N High St
- 1709 N Dodgion St
- 1709 N High St
- 1717 N Dodgion St
- 1720 N Dodgion St
- 1704 N Dodgion St
- 1707 N Dodgion St
- 1719 N High St
Your Personal Tour Guide
Ask me questions while you tour the home.