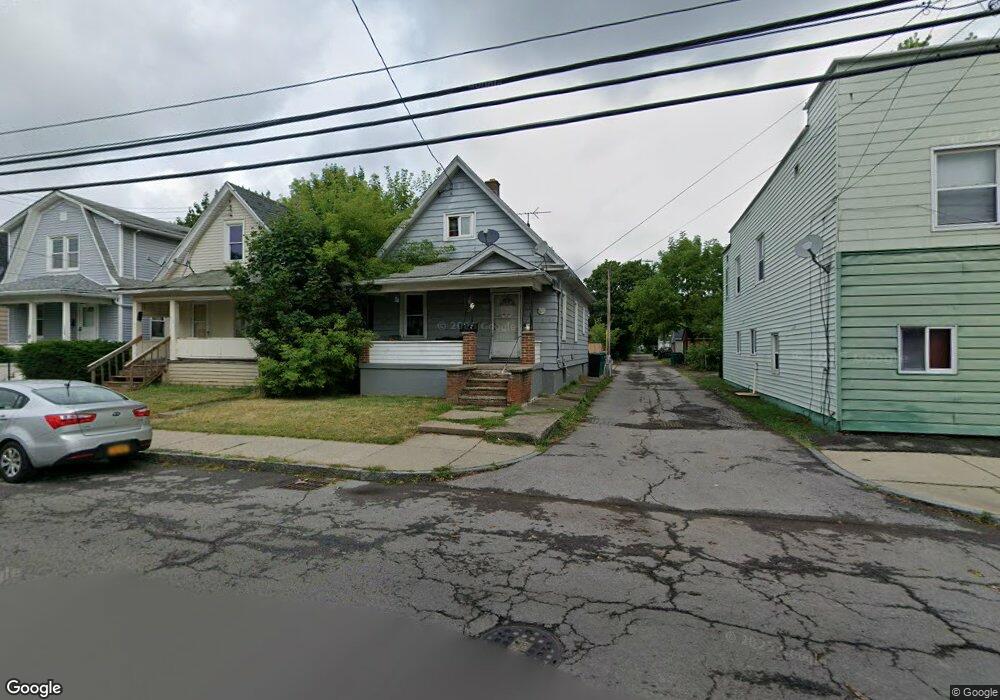
1712 Niagara St Niagara Falls, NY 14303
South End NeighborhoodEstimated Value: $58,000 - $85,000
2
Beds
1
Bath
858
Sq Ft
$88/Sq Ft
Est. Value
About This Home
This home is located at 1712 Niagara St, Niagara Falls, NY 14303 and is currently estimated at $75,363, approximately $87 per square foot. 1712 Niagara St is a home located in Niagara County with nearby schools including Niagara Falls High School and St. Joseph Elementary School.
Ownership History
Date
Name
Owned For
Owner Type
Purchase Details
Closed on
Oct 22, 2015
Sold by
Hook'S Handyman Service Llc Service Llc
Bought by
Peninsula Property Holdings Corp Holdings Cor
Current Estimated Value
Purchase Details
Closed on
Dec 5, 2014
Sold by
Buffalo Niagara Falls "Real Estate, Llc
Bought by
Hook'S Handyman "Service, Llc
Purchase Details
Closed on
Dec 4, 2014
Sold by
Buffalo Niagara Falls Real Estate Llc
Bought by
Hooks Handyman Service Llc
Purchase Details
Closed on
Jan 25, 2010
Sold by
M & R Development Inc
Bought by
Buffalo Nf Real Estate Llc
Purchase Details
Closed on
Feb 12, 2003
Sold by
Rose Greco
Bought by
M & R Development Inc
Create a Home Valuation Report for This Property
The Home Valuation Report is an in-depth analysis detailing your home's value as well as a comparison with similar homes in the area
Home Values in the Area
Average Home Value in this Area
Purchase History
| Date | Buyer | Sale Price | Title Company |
|---|---|---|---|
| Peninsula Property Holdings Corp Holdings Cor | $28,500 | -- | |
| Hook'S Handyman "Service, Llc | -- | Puleo & Puleo | |
| Hooks Handyman Service Llc | $19,000 | None Available | |
| Buffalo Nf Real Estate Llc | $1,000 | None Available | |
| M & R Development Inc | $24,000 | William D Berard Iii |
Source: Public Records
Tax History Compared to Growth
Tax History
| Year | Tax Paid | Tax Assessment Tax Assessment Total Assessment is a certain percentage of the fair market value that is determined by local assessors to be the total taxable value of land and additions on the property. | Land | Improvement |
|---|---|---|---|---|
| 2024 | $1,353 | $22,900 | $1,500 | $21,400 |
| 2023 | $1,107 | $22,900 | $1,500 | $21,400 |
| 2022 | $670 | $22,900 | $1,500 | $21,400 |
| 2021 | $670 | $22,900 | $1,500 | $21,400 |
| 2020 | $444 | $22,900 | $1,500 | $21,400 |
| 2019 | $427 | $22,900 | $1,500 | $21,400 |
| 2018 | $658 | $22,900 | $1,500 | $21,400 |
| 2017 | $427 | $22,900 | $1,500 | $21,400 |
| 2016 | $640 | $22,900 | $1,500 | $21,400 |
| 2015 | -- | $22,900 | $1,500 | $21,400 |
| 2014 | -- | $22,900 | $1,500 | $21,400 |
Source: Public Records
Map
Nearby Homes