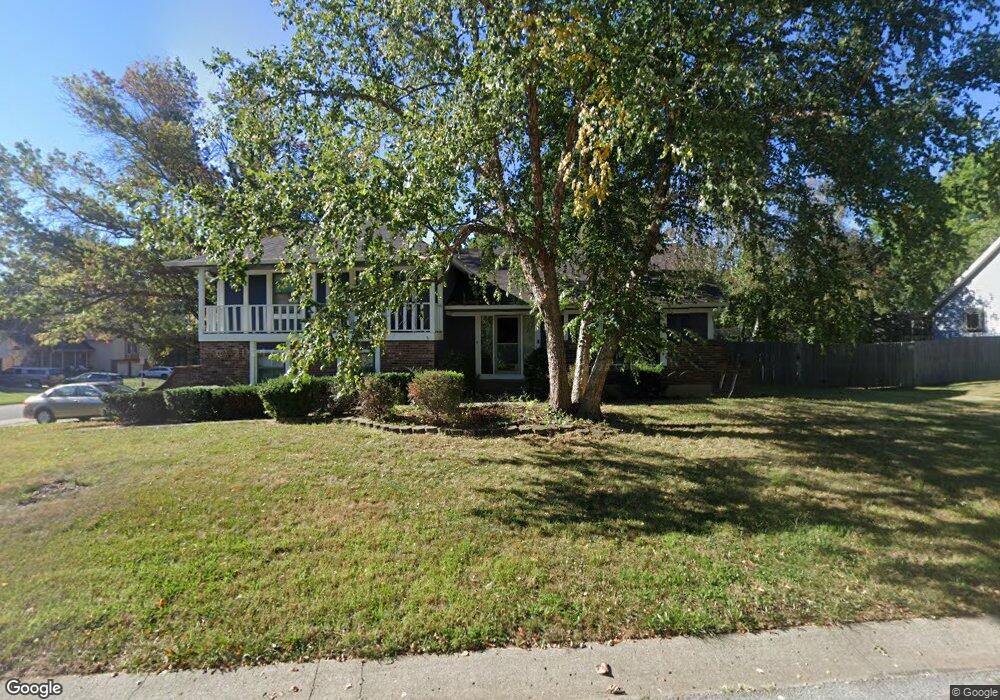
1712 NW Ash Ave Blue Springs, MO 64015
Estimated Value: $314,635 - $323,000
4
Beds
3
Baths
1,898
Sq Ft
$167/Sq Ft
Est. Value
About This Home
This home is located at 1712 NW Ash Ave, Blue Springs, MO 64015 and is currently estimated at $317,659, approximately $167 per square foot. 1712 NW Ash Ave is a home located in Jackson County with nearby schools including Thomas J. Ultican Elementary School, Paul Kinder Middle School, and Blue Springs High School.
Ownership History
Date
Name
Owned For
Owner Type
Purchase Details
Closed on
Dec 16, 2021
Sold by
Kornis Neil A and Kornis Staci D
Bought by
Kornis Staci D
Current Estimated Value
Home Financials for this Owner
Home Financials are based on the most recent Mortgage that was taken out on this home.
Original Mortgage
$150,000
Outstanding Balance
$137,719
Interest Rate
2.98%
Mortgage Type
New Conventional
Estimated Equity
$179,940
Purchase Details
Closed on
Mar 28, 2013
Sold by
Kroenke Arthur J and Kroenke Leta L
Bought by
Raytown 6 Llc
Purchase Details
Closed on
Aug 24, 2011
Sold by
Ealy Danny L and Ealy Danny
Bought by
Kornis Neal A and Kornis Staci D
Purchase Details
Closed on
Mar 23, 2006
Sold by
Liggett Robert E and Liggett Marsha L
Bought by
Ealy Danny L
Home Financials for this Owner
Home Financials are based on the most recent Mortgage that was taken out on this home.
Original Mortgage
$172,636
Interest Rate
6.32%
Mortgage Type
FHA
Create a Home Valuation Report for This Property
The Home Valuation Report is an in-depth analysis detailing your home's value as well as a comparison with similar homes in the area
Home Values in the Area
Average Home Value in this Area
Purchase History
| Date | Buyer | Sale Price | Title Company |
|---|---|---|---|
| Kornis Staci D | -- | None Available | |
| Raytown 6 Llc | -- | Chicago Title | |
| Kornis Neal A | -- | Kansas City Title Inc | |
| Ealy Danny | -- | Kansas City Title | |
| Ealy Danny | -- | Kansas City Title | |
| Ealy Danny L | -- | First American Title Ins Co |
Source: Public Records
Mortgage History
| Date | Status | Borrower | Loan Amount |
|---|---|---|---|
| Open | Kornis Staci D | $150,000 | |
| Previous Owner | Ealy Danny L | $172,636 |
Source: Public Records
Tax History Compared to Growth
Tax History
| Year | Tax Paid | Tax Assessment Tax Assessment Total Assessment is a certain percentage of the fair market value that is determined by local assessors to be the total taxable value of land and additions on the property. | Land | Improvement |
|---|---|---|---|---|
| 2025 | $4,148 | $53,521 | $6,270 | $47,251 |
| 2024 | $4,068 | $50,842 | $7,556 | $43,286 |
| 2023 | $4,068 | $50,842 | $6,171 | $44,671 |
| 2022 | $3,664 | $40,470 | $6,033 | $34,437 |
| 2021 | $3,661 | $40,470 | $6,033 | $34,437 |
| 2020 | $3,139 | $35,300 | $6,033 | $29,267 |
| 2019 | $3,035 | $35,300 | $6,033 | $29,267 |
| 2018 | $2,658 | $29,763 | $3,150 | $26,613 |
| 2017 | $2,551 | $29,763 | $3,150 | $26,613 |
| 2016 | $2,551 | $28,633 | $3,097 | $25,536 |
| 2014 | $2,399 | $26,843 | $3,083 | $23,760 |
Source: Public Records
Map
Nearby Homes
- 503 NW 15th St
- 1109 NW Mock Ave
- 305 NW 17th St
- 1109 NW B St
- 2317 NW Kensington Ct
- 1389 NW Jefferson Ct
- 804 NW Maynard St
- 2508 NW Castle Dr
- 913 NW Camelot Ct
- 1400 NW Deer Run Trail
- 2000 SW Smith St
- 1705 SW Walnut St
- 804 NW North Summit Cir
- 516 NW Mill Ct
- 2804 NW Kingsridge Dr
- 1513 NW Weatherstone Ct
- 1601 NW Weatherstone Ct
- 401 SW 18th St
- 1029 NW Berkshire Dr
- 2916 NW Chelsea Place
- 813 NW 18th St
- 1801 NW Ash Ave
- 809 NW 18th St
- 1711 NW Ash Ave
- 812 NW 19th St
- 818 NW 18th St
- 809 NW 18 St
- 812 NW 18th St
- 1709 NW Ash Ave
- 824 NW 18th St
- 824 NW 19th St
- 808 NW 19th St
- 808 NW 18th St
- 1712 NW Ashton Dr
- 1800 NW Ashton Dr
- 815 NW 17th St
- 804 NW 18th St
- 817 NW 19th St
- 821 NW 19th St
- 1804 NW Ashton Dr