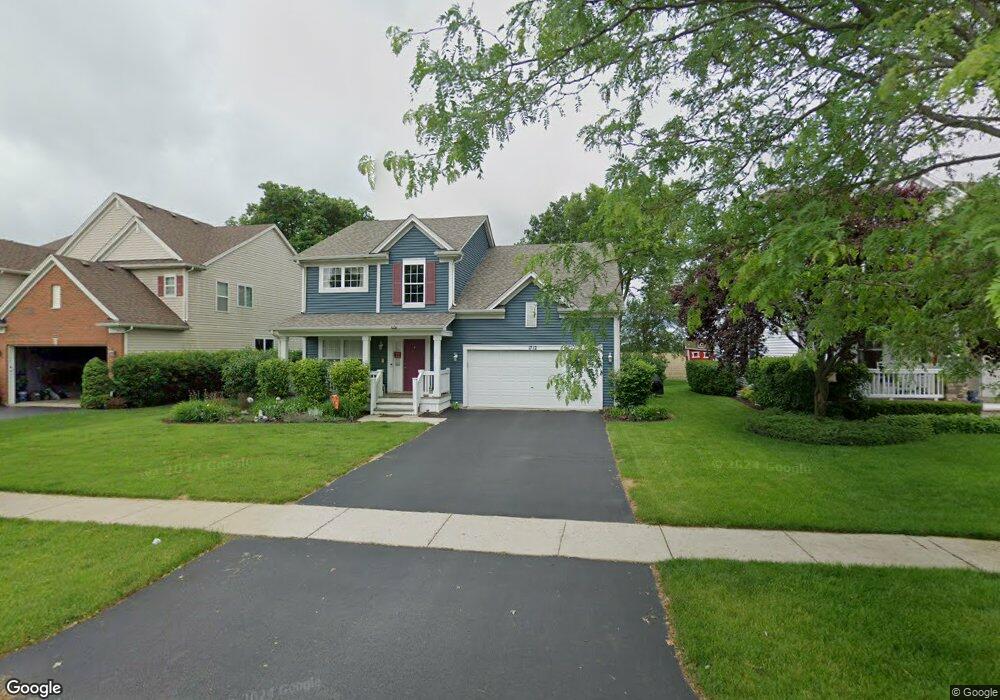
1712 Serenity Dr Antioch, IL 60002
Estimated Value: $377,000 - $387,000
3
Beds
3
Baths
1,512
Sq Ft
$253/Sq Ft
Est. Value
About This Home
This home is located at 1712 Serenity Dr, Antioch, IL 60002 and is currently estimated at $382,054, approximately $252 per square foot. 1712 Serenity Dr is a home located in Lake County with nearby schools including Antioch Community High School.
Ownership History
Date
Name
Owned For
Owner Type
Purchase Details
Closed on
Nov 13, 2017
Sold by
Alvarado Raymundo and Alvarado Kellie M
Bought by
Hansen Laura
Current Estimated Value
Home Financials for this Owner
Home Financials are based on the most recent Mortgage that was taken out on this home.
Original Mortgage
$206,959
Outstanding Balance
$174,059
Interest Rate
3.99%
Mortgage Type
FHA
Estimated Equity
$207,995
Purchase Details
Closed on
Nov 18, 2016
Sold by
Goodrich Kellie M and Alvarado Kellie M
Bought by
Alvarado Kellie M and Alvarado Raymundo
Home Financials for this Owner
Home Financials are based on the most recent Mortgage that was taken out on this home.
Original Mortgage
$211,100
Interest Rate
4.37%
Mortgage Type
New Conventional
Purchase Details
Closed on
Mar 23, 2007
Sold by
Neumann Homes Inc
Bought by
Goodrich Kellie M
Home Financials for this Owner
Home Financials are based on the most recent Mortgage that was taken out on this home.
Original Mortgage
$209,960
Interest Rate
6.2%
Mortgage Type
Construction
Create a Home Valuation Report for This Property
The Home Valuation Report is an in-depth analysis detailing your home's value as well as a comparison with similar homes in the area
Home Values in the Area
Average Home Value in this Area
Purchase History
| Date | Buyer | Sale Price | Title Company |
|---|---|---|---|
| Hansen Laura | $226,000 | Attorneys Title Guaranty Fun | |
| Alvarado Kellie M | -- | Fidelity National Title | |
| Goodrich Kellie M | $262,500 | Chicago Title Insurance Co |
Source: Public Records
Mortgage History
| Date | Status | Borrower | Loan Amount |
|---|---|---|---|
| Open | Hansen Laura | $206,959 | |
| Previous Owner | Alvarado Kellie M | $211,100 | |
| Previous Owner | Goodrich Kellie M | $209,960 |
Source: Public Records
Tax History Compared to Growth
Tax History
| Year | Tax Paid | Tax Assessment Tax Assessment Total Assessment is a certain percentage of the fair market value that is determined by local assessors to be the total taxable value of land and additions on the property. | Land | Improvement |
|---|---|---|---|---|
| 2024 | $11,127 | $101,457 | $12,453 | $89,004 |
| 2023 | $11,091 | $90,847 | $11,151 | $79,696 |
| 2022 | $11,091 | $87,000 | $8,955 | $78,045 |
| 2021 | $10,479 | $81,180 | $8,356 | $72,824 |
| 2020 | $10,306 | $78,938 | $8,125 | $70,813 |
| 2019 | $10,421 | $75,488 | $7,770 | $67,718 |
| 2018 | $8,412 | $63,340 | $10,510 | $52,830 |
| 2017 | $7,936 | $53,920 | $10,005 | $43,915 |
| 2016 | $7,750 | $52,036 | $9,655 | $42,381 |
| 2015 | $5,623 | $50,712 | $9,409 | $41,303 |
| 2014 | $5,402 | $50,454 | $9,452 | $41,002 |
| 2012 | $5,411 | $52,612 | $9,452 | $43,160 |
Source: Public Records
Map
Nearby Homes
- 895 Timber Lake Dr
- 865 Sterling Heights Dr
- 22031 W Spruce Dr
- 41092 N Deep Lake Rd
- 40472 N Donald Dr
- 39930 Savage Rd
- 1328 Blue Heron Cir
- 40963 N Champaign Dr
- 22220 W Loon Dr
- 1286 Goldfinch Ln
- 22271 W Loon Dr
- 1082 Holly Dr
- 20215 W Miller Rd
- 1704 Cherry Ct
- 1101 N Deep Lake Rd
- 1650 Natures Way
- 1063 Joy Ct
- 41147 N Lincoln Ave
- 631 Hidden Creek Dr
- 1214 Jerome Ct
- 1696 Serenity Dr
- 1715 Serenity Dr
- 1692 Serenity Dr
- 1734 Serenity Ct
- 1711 Serenity Dr
- 1703 Serenity Dr
- 1735 Serenity Ct
- 1688 Serenity Dr
- 1738 Serenity Ct
- 1695 Serenity Dr
- 1739 Serenity Ct
- 1708 Centennial Dr
- 1691 Serenity Dr
- 1714 Centennial Dr
- 1684 Serenity Dr
- 1744 Serenity Ct
- 821 Forest View Way
- 1741 Serenity Ct
- 1694 Centennial Dr
- 1687 Serenity Dr