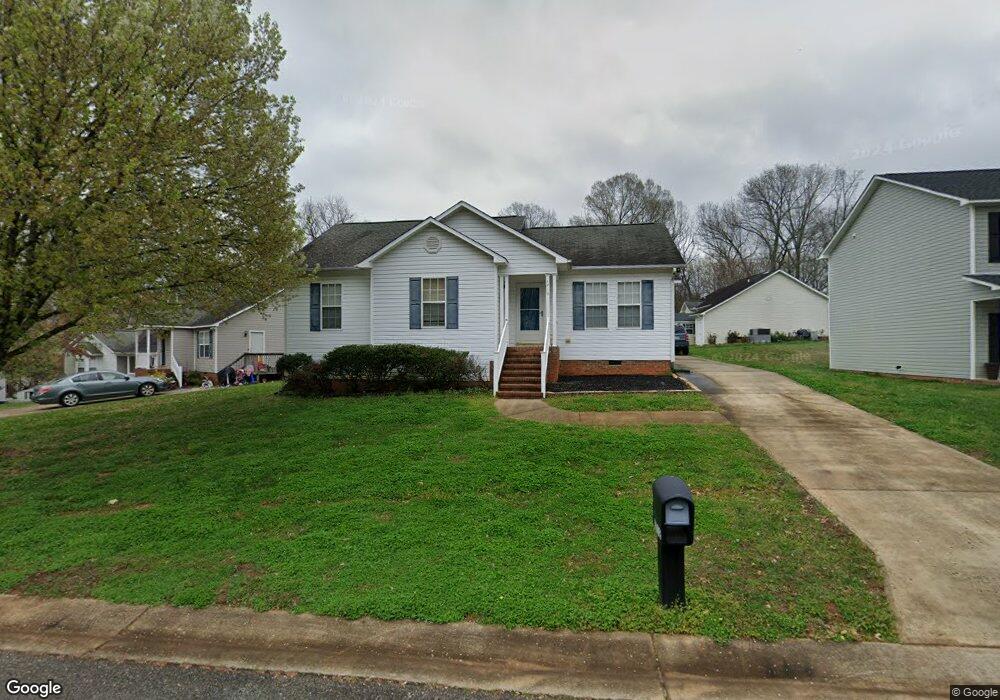
1712 Singing Sound Way Dr Siler City, NC 27344
Estimated Value: $219,321 - $260,000
3
Beds
2
Baths
1,141
Sq Ft
$207/Sq Ft
Est. Value
About This Home
This home is located at 1712 Singing Sound Way Dr, Siler City, NC 27344 and is currently estimated at $235,830, approximately $206 per square foot. 1712 Singing Sound Way Dr is a home located in Chatham County with nearby schools including Siler City Elementary School, Chatham Middle, and Jordan Matthews High.
Ownership History
Date
Name
Owned For
Owner Type
Purchase Details
Closed on
Apr 2, 2008
Sold by
Cook Timothy Michael and Cook Kim Yvette
Bought by
Cook Kim Yvette
Current Estimated Value
Create a Home Valuation Report for This Property
The Home Valuation Report is an in-depth analysis detailing your home's value as well as a comparison with similar homes in the area
Home Values in the Area
Average Home Value in this Area
Purchase History
| Date | Buyer | Sale Price | Title Company |
|---|---|---|---|
| Cook Kim Yvette | -- | None Available |
Source: Public Records
Tax History Compared to Growth
Tax History
| Year | Tax Paid | Tax Assessment Tax Assessment Total Assessment is a certain percentage of the fair market value that is determined by local assessors to be the total taxable value of land and additions on the property. | Land | Improvement |
|---|---|---|---|---|
| 2024 | $2,726 | $145,378 | $10,710 | $134,668 |
| 2023 | $1,839 | $145,378 | $10,710 | $134,668 |
| 2022 | $1,752 | $145,378 | $10,710 | $134,668 |
| 2021 | $1,752 | $145,378 | $10,710 | $134,668 |
| 2020 | $1,114 | $92,044 | $15,000 | $77,044 |
| 2019 | $1,114 | $92,044 | $15,000 | $77,044 |
| 2018 | $1,048 | $92,044 | $15,000 | $77,044 |
| 2017 | $1,048 | $92,044 | $15,000 | $77,044 |
| 2016 | $1,209 | $108,554 | $15,000 | $93,554 |
| 2015 | $1,196 | $108,554 | $15,000 | $93,554 |
| 2014 | $1,196 | $108,554 | $15,000 | $93,554 |
| 2013 | -- | $108,554 | $15,000 | $93,554 |
Source: Public Records
Map
Nearby Homes
- 1501 Duet Dr
- 1004 Candlewood Cir
- 1011 Candlewood Cir
- 1007 Driftwood Dr
- 806 Cliftwood Dr
- 803 Woodland Dr
- 516 W 4th St
- 2200 W 3rd St
- Tbd W 3rd St
- 1306 Sunset Dr
- 2248 W 3rd St
- 409 E 10th St
- 519 W Raleigh St
- Tbd Stockyard Rd
- 978 Stockyard Rd
- 314 Eden Hills Rd
- 0 Brower Rd
- 707 Lakewood Dr
- 3125 W 3rd St
- 303 W Dolphin St
- 1714 Singing Sound Way Dr
- 1710 Singing Sound Way Dr
- 1703 Wind Sound Way
- 1701 Wind Sound Way Dr
- 1708 Singing Sound Way Dr
- 1716 Singing Sound Way Dr
- 1713 Singing Sound Way Dr
- 1715 Singing Sound Way Dr
- 1711 Singing Sound Way Dr
- 1717 Singing Sound Way Dr
- LOT 91 Singing Sound Way Dr
- LOT 90 Singing Sound Way Dr
- 0 Singing Sound Way Dr
- 1718 Singing Sound Way Dr
- 1709 Singing Sound Way
- 0 Wind Sound Way Unit 1787241
- 0 Wind Sound Way Unit 87 1787241
- 1709 Singing Sound Way Dr
- 1719 Singing Sound Way Dr
- 1720 Singing Sound Way Dr