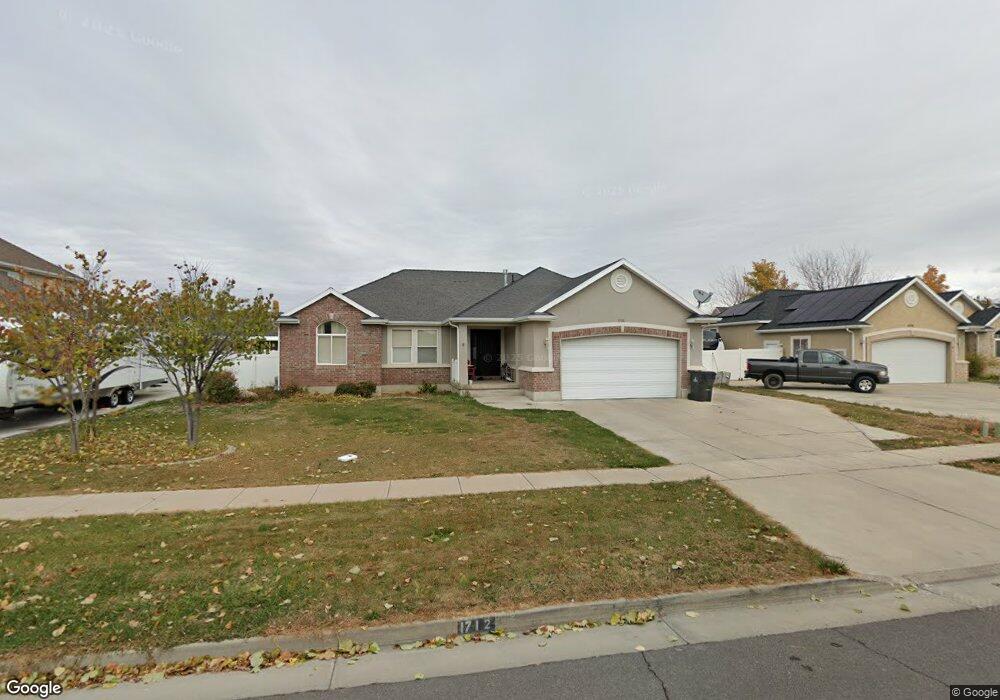
1712 W 2575 S Syracuse, UT 84075
Estimated Value: $592,000 - $670,000
5
Beds
3
Baths
3,182
Sq Ft
$194/Sq Ft
Est. Value
About This Home
This home is located at 1712 W 2575 S, Syracuse, UT 84075 and is currently estimated at $615,871, approximately $193 per square foot. 1712 W 2575 S is a home located in Davis County with nearby schools including Syracuse Elementary School, Syracuse Junior High School, and Syracuse High School.
Ownership History
Date
Name
Owned For
Owner Type
Purchase Details
Closed on
May 25, 2021
Sold by
Lin Kernel and Lin Qing
Bought by
Wu Liang and Zhang Dan
Current Estimated Value
Home Financials for this Owner
Home Financials are based on the most recent Mortgage that was taken out on this home.
Original Mortgage
$384,000
Outstanding Balance
$347,456
Interest Rate
3%
Mortgage Type
New Conventional
Estimated Equity
$268,415
Purchase Details
Closed on
Mar 31, 2016
Sold by
Morales Angela
Bought by
Lin Kemei and Lin Qing
Purchase Details
Closed on
Mar 16, 1999
Sold by
Rainey Construction Inc
Bought by
Pectol Ryan M and Pectol Angela
Home Financials for this Owner
Home Financials are based on the most recent Mortgage that was taken out on this home.
Original Mortgage
$166,250
Interest Rate
6.73%
Create a Home Valuation Report for This Property
The Home Valuation Report is an in-depth analysis detailing your home's value as well as a comparison with similar homes in the area
Home Values in the Area
Average Home Value in this Area
Purchase History
| Date | Buyer | Sale Price | Title Company |
|---|---|---|---|
| Wu Liang | -- | Pinnacle Title Ins Ag | |
| Lin Kemei | -- | Northwest Title | |
| Pectol Ryan M | -- | First American Title Co |
Source: Public Records
Mortgage History
| Date | Status | Borrower | Loan Amount |
|---|---|---|---|
| Open | Wu Liang | $384,000 | |
| Previous Owner | Pectol Ryan M | $166,250 |
Source: Public Records
Tax History
| Year | Tax Paid | Tax Assessment Tax Assessment Total Assessment is a certain percentage of the fair market value that is determined by local assessors to be the total taxable value of land and additions on the property. | Land | Improvement |
|---|---|---|---|---|
| 2025 | $3,181 | $306,900 | $125,024 | $181,876 |
| 2024 | $3,007 | $292,050 | $103,457 | $188,593 |
| 2023 | $2,836 | $502,000 | $144,152 | $357,848 |
| 2022 | $2,970 | $288,200 | $82,972 | $205,228 |
| 2021 | $2,663 | $400,000 | $122,621 | $277,379 |
| 2020 | $2,400 | $349,000 | $106,789 | $242,211 |
| 2019 | $2,278 | $327,000 | $104,414 | $222,586 |
| 2018 | $2,267 | $323,000 | $100,824 | $222,176 |
| 2016 | $1,892 | $141,405 | $38,697 | $102,708 |
| 2015 | $1,866 | $132,825 | $38,697 | $94,128 |
| 2014 | $1,847 | $133,931 | $38,697 | $95,234 |
| 2013 | -- | $132,896 | $36,655 | $96,241 |
Source: Public Records
Map
Nearby Homes
- 1686 W 2425 S
- 1651 W 2700 S Unit 217
- 1643 W 2700 S Unit 216
- 2732 S Allison Way Unit 214
- 2742 S Allison Way Unit 212
- 2721 S Allison Way
- 1667 W 2770 S Unit 206
- 1876 W 2400 S
- 1826 W 2350 S
- 1466 W 2425 S
- 2734 S Allison Way Unit 213
- 2968 Old Emigrant Rd
- 1694 2975 S Unit D
- 1664 2975 S Unit B
- 2894 Trailside Dr
- 1315 W 2325 S
- 1295 W 2325 S
- 1306 W 2325 S
- 1392 W 2175 S
- 2356 S 1230 W
Your Personal Tour Guide
Ask me questions while you tour the home.