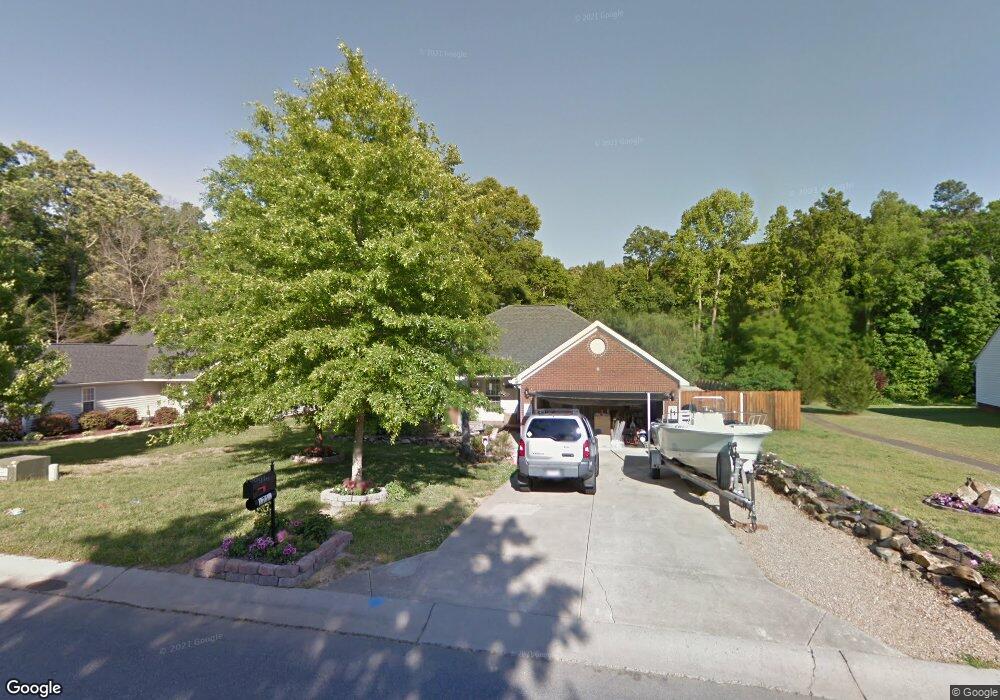
1712 Winthrop Ln Monroe, NC 28110
Estimated Value: $310,000 - $345,000
--
Bed
2
Baths
1,309
Sq Ft
$252/Sq Ft
Est. Value
About This Home
This home is located at 1712 Winthrop Ln, Monroe, NC 28110 and is currently estimated at $330,412, approximately $252 per square foot. 1712 Winthrop Ln is a home located in Union County with nearby schools including Rocky River Elementary School, Monroe Middle School, and Monroe High School.
Ownership History
Date
Name
Owned For
Owner Type
Purchase Details
Closed on
May 13, 2021
Sold by
Bundy Alexis and Beachum Derik
Bought by
Bundy Alexis and Beachum Derik
Current Estimated Value
Home Financials for this Owner
Home Financials are based on the most recent Mortgage that was taken out on this home.
Original Mortgage
$211,000
Outstanding Balance
$191,219
Interest Rate
3.1%
Mortgage Type
New Conventional
Estimated Equity
$139,193
Purchase Details
Closed on
Apr 7, 2020
Sold by
Moore Jesse C and Moore Erin Hadden
Bought by
Bundy Alexis
Home Financials for this Owner
Home Financials are based on the most recent Mortgage that was taken out on this home.
Original Mortgage
$210,123
Interest Rate
3.62%
Mortgage Type
FHA
Purchase Details
Closed on
Apr 26, 2000
Sold by
Persis Nova Construction Inc
Bought by
Moore Jesse C and Hadden Erin L
Home Financials for this Owner
Home Financials are based on the most recent Mortgage that was taken out on this home.
Original Mortgage
$119,250
Interest Rate
8.24%
Mortgage Type
FHA
Create a Home Valuation Report for This Property
The Home Valuation Report is an in-depth analysis detailing your home's value as well as a comparison with similar homes in the area
Home Values in the Area
Average Home Value in this Area
Purchase History
| Date | Buyer | Sale Price | Title Company |
|---|---|---|---|
| Bundy Alexis | -- | Tryon Title Agency Llc | |
| Bundy Alexis | $214,000 | Carolina Title | |
| Moore Jesse C | $121,000 | -- |
Source: Public Records
Mortgage History
| Date | Status | Borrower | Loan Amount |
|---|---|---|---|
| Open | Bundy Alexis | $211,000 | |
| Closed | Bundy Alexis | $210,123 | |
| Previous Owner | Moore Jesse C | $119,250 |
Source: Public Records
Tax History Compared to Growth
Tax History
| Year | Tax Paid | Tax Assessment Tax Assessment Total Assessment is a certain percentage of the fair market value that is determined by local assessors to be the total taxable value of land and additions on the property. | Land | Improvement |
|---|---|---|---|---|
| 2024 | $2,230 | $204,500 | $42,500 | $162,000 |
| 2023 | $2,230 | $204,500 | $42,500 | $162,000 |
| 2022 | $2,230 | $204,500 | $42,500 | $162,000 |
| 2021 | $2,230 | $204,500 | $42,500 | $162,000 |
| 2020 | $1,811 | $134,400 | $28,000 | $106,400 |
| 2019 | $1,811 | $134,400 | $28,000 | $106,400 |
| 2018 | $828 | $134,400 | $28,000 | $106,400 |
| 2017 | $1,838 | $134,400 | $28,000 | $106,400 |
| 2016 | $1,818 | $134,400 | $28,000 | $106,400 |
| 2015 | $1,044 | $134,400 | $28,000 | $106,400 |
| 2014 | $1,662 | $136,200 | $27,500 | $108,700 |
Source: Public Records
Map
Nearby Homes
- 1825 Winfield Dr
- 1604 Winthrop Ln
- 1433 Winthrop Ln
- 1716 Sue St
- 3211 Old Charlotte Hwy
- 1018 Lake Como Dr
- 2930 Old Charlotte Hwy
- 1308 Trull Place
- 3411 Romany Dr
- 2101 Shady Ln
- 1914 John Moore Rd
- 2005 Overhill Dr
- 2526 Goldmine Rd
- 935 Wind Carved Ln
- 2600 Foxworth Dr
- 2532 Carroll St
- 2506 Foxworth Dr
- TBD Stevens Rd Unit 3
- 000 Stevens Rd Unit 2
- 2402 Bearskin Ln
- 1712 Winthrop Ln Unit 25
- 1716 Winthrop Ln
- 1708 Winthrop Ln
- 1708 Winthrop Ln Unit 26
- 1704 Winthrop Ln
- 1711 Winthrop Ln
- 1715 Winthrop Ln
- 3200 Continental Dr
- 1700 Winthrop Ln
- 3204 Continental Dr
- 1638 Sumpter Ln
- 3208 Continental Dr
- 1641 Winthrop Ln
- 3212 Continental Dr
- 1634 Sumpter Ln
- 1637 Winthrop Ln
- 3209 Continental Dr
- 1632 Winthrop Ln
- 1632 Winthrop Ln Unit 31
- 1629 Sumpter Ln