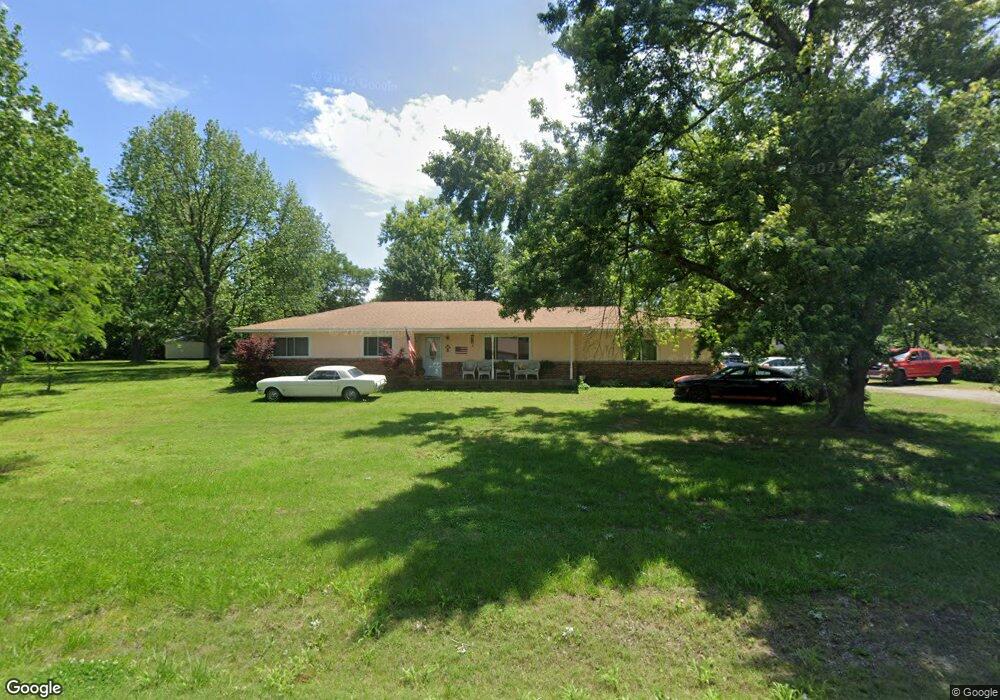
17128 Irish Rd Carthage, MO 64836
Estimated Value: $240,524 - $270,000
4
Beds
2
Baths
1,784
Sq Ft
$140/Sq Ft
Est. Value
About This Home
This home is located at 17128 Irish Rd, Carthage, MO 64836 and is currently estimated at $250,131, approximately $140 per square foot. 17128 Irish Rd is a home located in Jasper County with nearby schools including Carthage High School and Victory Academy.
Ownership History
Date
Name
Owned For
Owner Type
Purchase Details
Closed on
Jun 21, 2017
Sold by
Sampson Samuel Lane and Sampson Ashly Paige
Bought by
Corner Melissa and Corner Arrona K
Current Estimated Value
Home Financials for this Owner
Home Financials are based on the most recent Mortgage that was taken out on this home.
Original Mortgage
$117,727
Outstanding Balance
$97,709
Interest Rate
3.94%
Mortgage Type
FHA
Estimated Equity
$152,422
Purchase Details
Closed on
Sep 22, 2004
Sold by
Brown Denzil L and Brown Virginia L
Bought by
Sampson Samuel Lane and Sampson Ashly Paige
Home Financials for this Owner
Home Financials are based on the most recent Mortgage that was taken out on this home.
Original Mortgage
$69,600
Interest Rate
5.86%
Mortgage Type
Purchase Money Mortgage
Purchase Details
Closed on
Mar 9, 2004
Sold by
Coneby Gary L and Coneby Wanda J
Bought by
Brown Denzil L and Brown Virginia L
Create a Home Valuation Report for This Property
The Home Valuation Report is an in-depth analysis detailing your home's value as well as a comparison with similar homes in the area
Home Values in the Area
Average Home Value in this Area
Purchase History
| Date | Buyer | Sale Price | Title Company |
|---|---|---|---|
| Corner Melissa | -- | None Available | |
| Sampson Samuel Lane | -- | None Available | |
| Comer Melissa | -- | None Available | |
| Sampson Samuel Lane | -- | -- | |
| Brown Denzil L | $63,800 | -- |
Source: Public Records
Mortgage History
| Date | Status | Borrower | Loan Amount |
|---|---|---|---|
| Open | Corner Melissa | $117,727 | |
| Previous Owner | Sampson Samuel Lane | $69,600 | |
| Closed | Sampson Samuel Lane | $17,400 |
Source: Public Records
Tax History Compared to Growth
Tax History
| Year | Tax Paid | Tax Assessment Tax Assessment Total Assessment is a certain percentage of the fair market value that is determined by local assessors to be the total taxable value of land and additions on the property. | Land | Improvement |
|---|---|---|---|---|
| 2024 | $946 | $20,230 | $1,660 | $18,570 |
| 2023 | $946 | $20,230 | $1,660 | $18,570 |
| 2022 | $883 | $19,890 | $1,660 | $18,230 |
| 2021 | $883 | $19,890 | $1,660 | $18,230 |
| 2020 | $883 | $18,430 | $1,660 | $16,770 |
| 2019 | $885 | $18,430 | $1,660 | $16,770 |
| 2018 | $793 | $16,530 | $0 | $0 |
| 2017 | $795 | $16,530 | $0 | $0 |
| 2016 | $708 | $14,760 | $0 | $0 |
| 2015 | $649 | $14,760 | $0 | $0 |
| 2014 | $649 | $14,760 | $0 | $0 |
Source: Public Records
Map
Nearby Homes
- 1019 Hawthorne St
- 16537 Isis Rd
- 16549 Inca Rd
- 902 S Quail Run
- Tbd S Country Club Rd
- 17546 State Highway 96
- 000 County Lane 175
- 2012 Beau Dr
- 2038 W Trolley Car Ln
- 2000 Amber Ln
- 1516 Alexandra Dr
- Lot 3 2nd Addition (Piper Dr) Unit 3
- 1641 Alexandra Dr
- Lot 3 2nd Addition (Piper)
- 17279 Jackpine Rd
- 1615 W Budlong St
- 1704 Liam St
- 16575 Fir Rd
- 1422 W Macon St
- 18280 State Highway 96
- 17144 Irish Rd
- 17074 Irish Rd
- 17012 Ignition Ln
- 17133 Irish Rd
- 17153 Hawthorne Rd
- 17083 Irish Rd
- 17083 Irish Rd Unit 1
- 17168 Irish Rd
- 17169 Irish Rd
- 17096 Isabel Ln
- 17124 Isabel Ln
- 17102 Hawthorne Rd
- 17202 Irish Rd
- 17072 Isabel Ln
- 17124 Hawthorne Rd
- 17203 Hawthorne Rd
- 17168 Isabel Ln
- 8072 County Road 170
- 17068 Hawthorne Rd
- 17184 Hawthorne Rd