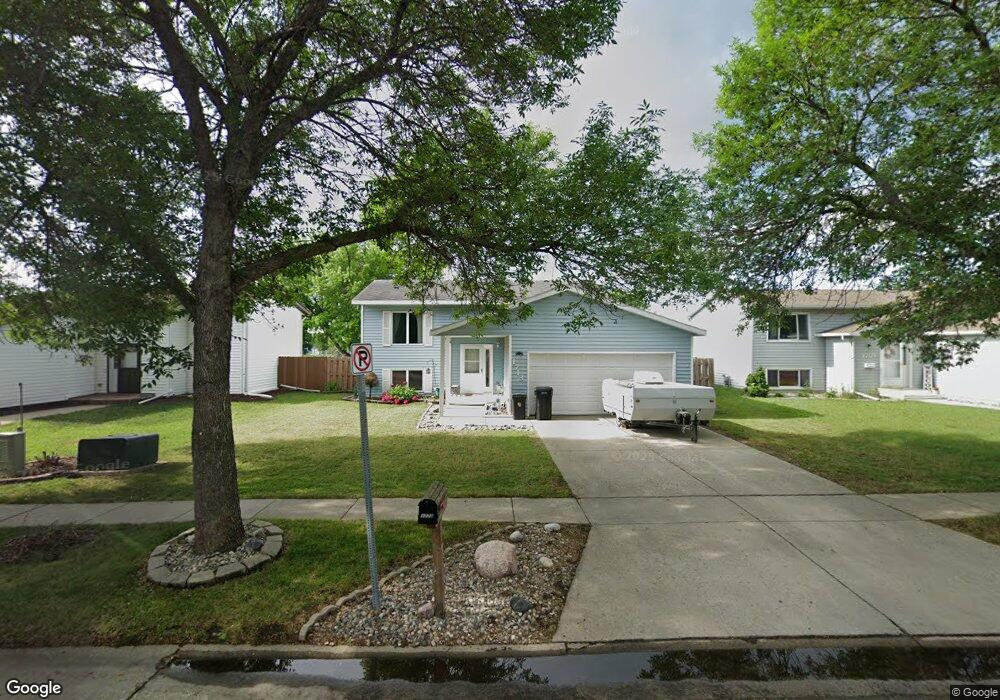
1713 4th Ave E West Fargo, ND 58078
Meadowridge NeighborhoodEstimated Value: $233,000 - $290,822
4
Beds
2
Baths
1,926
Sq Ft
$136/Sq Ft
Est. Value
About This Home
This home is located at 1713 4th Ave E, West Fargo, ND 58078 and is currently estimated at $261,911, approximately $135 per square foot. 1713 4th Ave E is a home located in Cass County with nearby schools including L.E. Berger Elementary School, Cheney Middle School, and West Fargo High School.
Ownership History
Date
Name
Owned For
Owner Type
Purchase Details
Closed on
Dec 29, 2010
Sold by
Lopez Daniel D and Lopez Cassie B
Bought by
Lopez Cassie B
Current Estimated Value
Home Financials for this Owner
Home Financials are based on the most recent Mortgage that was taken out on this home.
Original Mortgage
$118,249
Interest Rate
4.37%
Mortgage Type
FHA
Create a Home Valuation Report for This Property
The Home Valuation Report is an in-depth analysis detailing your home's value as well as a comparison with similar homes in the area
Home Values in the Area
Average Home Value in this Area
Purchase History
| Date | Buyer | Sale Price | Title Company |
|---|---|---|---|
| Lopez Cassie B | -- | -- |
Source: Public Records
Mortgage History
| Date | Status | Borrower | Loan Amount |
|---|---|---|---|
| Closed | Lopez Cassie B | $118,249 |
Source: Public Records
Tax History
| Year | Tax Paid | Tax Assessment Tax Assessment Total Assessment is a certain percentage of the fair market value that is determined by local assessors to be the total taxable value of land and additions on the property. | Land | Improvement |
|---|---|---|---|---|
| 2024 | $3,324 | $117,600 | $23,300 | $94,300 |
| 2023 | $3,223 | $113,000 | $23,300 | $89,700 |
| 2022 | $3,168 | $106,350 | $23,300 | $83,050 |
| 2021 | $3,004 | $96,750 | $14,550 | $82,200 |
| 2020 | $2,875 | $94,500 | $14,550 | $79,950 |
| 2019 | $2,758 | $91,450 | $14,550 | $76,900 |
| 2018 | $2,613 | $89,050 | $14,550 | $74,500 |
| 2017 | $2,692 | $88,300 | $14,550 | $73,750 |
| 2016 | $2,381 | $86,150 | $14,550 | $71,600 |
| 2015 | $2,226 | $76,550 | $10,600 | $65,950 |
| 2014 | $2,192 | $71,550 | $10,600 | $60,950 |
| 2013 | $2,229 | $71,550 | $10,600 | $60,950 |
Source: Public Records
Map
Nearby Homes
- 2008 5th Ave E
- 1726 2nd Ave E
- 1618 Suntree Dr
- 1610 Suntree Dr
- 2120 4th Ave E
- 2119 2nd Ave E
- 804 51st St S
- 1332 Sandstone Dr
- 2150 2nd Ave E
- 921 Homestead Ct
- 1059 Sommerset Place
- 1511 11th Ave E
- 801 9th St E
- 832 5th Ave E
- 531 Santa Cruz Dr Unit 333
- 341 Santa Cruz Dr Unit 305
- 631 7th Ave E
- 1424 14th St E Unit 11
- 622 12th Ave E
- 431 5th Ave E Unit 1
Your Personal Tour Guide
Ask me questions while you tour the home.