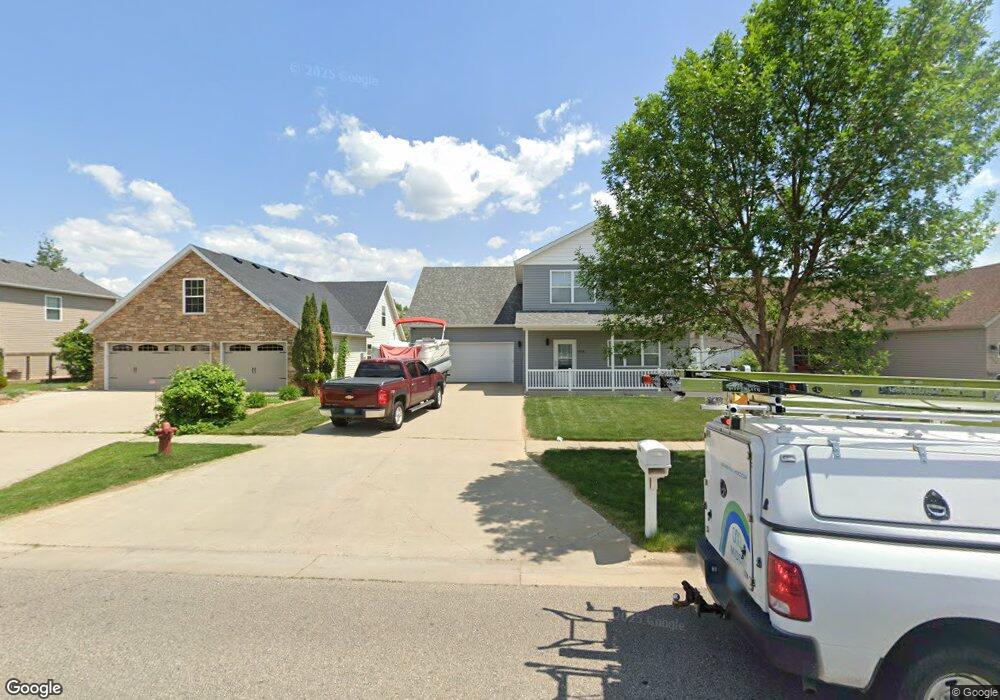
1713 7th St W West Fargo, ND 58078
Elmwood Court NeighborhoodEstimated Value: $356,000 - $364,186
3
Beds
3
Baths
1,992
Sq Ft
$181/Sq Ft
Est. Value
About This Home
This home is located at 1713 7th St W, West Fargo, ND 58078 and is currently estimated at $360,093, approximately $180 per square foot. 1713 7th St W is a home located in Cass County with nearby schools including Westside Elementary School, Cheney Middle School, and West Fargo High School.
Ownership History
Date
Name
Owned For
Owner Type
Purchase Details
Closed on
Feb 16, 2016
Sold by
Froehlich Angela and Froehlich Justin Lee
Bought by
Winfield Ryan J and Winfield Haley F
Current Estimated Value
Home Financials for this Owner
Home Financials are based on the most recent Mortgage that was taken out on this home.
Original Mortgage
$220,924
Outstanding Balance
$172,726
Interest Rate
3.37%
Mortgage Type
FHA
Estimated Equity
$187,367
Purchase Details
Closed on
Sep 19, 2013
Sold by
Ripplinger David G and Ripplinger Traci R
Bought by
Murray Angela
Home Financials for this Owner
Home Financials are based on the most recent Mortgage that was taken out on this home.
Original Mortgage
$183,607
Interest Rate
4.12%
Mortgage Type
FHA
Purchase Details
Closed on
Jan 16, 2006
Sold by
Homeland Developers Inc
Bought by
Ripplinger David G and Ripplinger Traci R
Home Financials for this Owner
Home Financials are based on the most recent Mortgage that was taken out on this home.
Original Mortgage
$131,300
Interest Rate
5.37%
Mortgage Type
Adjustable Rate Mortgage/ARM
Create a Home Valuation Report for This Property
The Home Valuation Report is an in-depth analysis detailing your home's value as well as a comparison with similar homes in the area
Home Values in the Area
Average Home Value in this Area
Purchase History
| Date | Buyer | Sale Price | Title Company |
|---|---|---|---|
| Winfield Ryan J | -- | Title Co | |
| Murray Angela | $187,000 | Title Co | |
| Ripplinger David G | -- | -- |
Source: Public Records
Mortgage History
| Date | Status | Borrower | Loan Amount |
|---|---|---|---|
| Open | Winfield Ryan J | $220,924 | |
| Previous Owner | Murray Angela | $183,607 | |
| Previous Owner | Ripplinger David G | $131,300 |
Source: Public Records
Tax History Compared to Growth
Tax History
| Year | Tax Paid | Tax Assessment Tax Assessment Total Assessment is a certain percentage of the fair market value that is determined by local assessors to be the total taxable value of land and additions on the property. | Land | Improvement |
|---|---|---|---|---|
| 2024 | $3,949 | $152,250 | $22,300 | $129,950 |
| 2023 | $4,271 | $145,200 | $22,300 | $122,900 |
| 2022 | $4,214 | $137,300 | $22,300 | $115,000 |
| 2021 | $4,131 | $125,850 | $17,800 | $108,050 |
| 2020 | $3,801 | $117,300 | $17,800 | $99,500 |
| 2019 | $3,712 | $118,750 | $17,800 | $100,950 |
| 2018 | $3,986 | $119,900 | $17,800 | $102,100 |
| 2017 | $4,706 | $120,050 | $17,800 | $102,250 |
| 2016 | $4,399 | $117,350 | $17,800 | $99,550 |
| 2015 | $4,472 | $108,600 | $12,200 | $96,400 |
| 2014 | $4,451 | $100,750 | $12,200 | $88,550 |
| 2013 | $4,362 | $98,150 | $12,200 | $85,950 |
Source: Public Records
Map
Nearby Homes