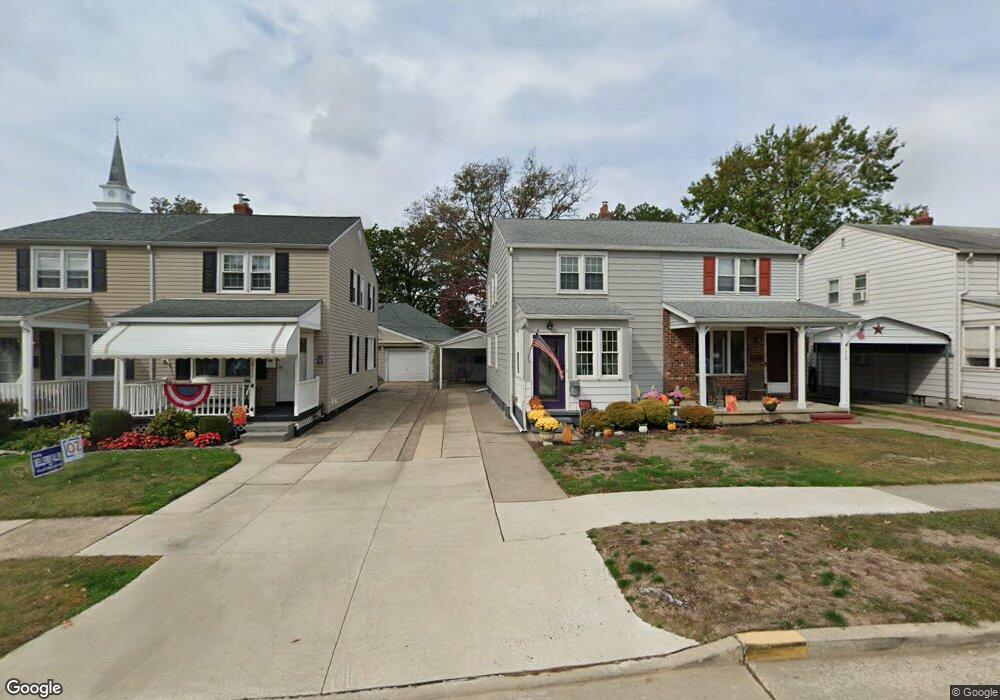
1713 Benson Place Bristol, PA 19007
Estimated Value: $275,000 - $284,645
--
Bed
1
Bath
1,024
Sq Ft
$273/Sq Ft
Est. Value
About This Home
This home is located at 1713 Benson Place, Bristol, PA 19007 and is currently estimated at $279,661, approximately $273 per square foot. 1713 Benson Place is a home located in Bucks County with nearby schools including Snyder-Girotti Elementary School, Bristol High School, and First Presbyterian Church School.
Ownership History
Date
Name
Owned For
Owner Type
Purchase Details
Closed on
Jun 28, 2017
Sold by
Wllick Thomas J and Wllick Laura L
Bought by
Young Patricia Y
Current Estimated Value
Home Financials for this Owner
Home Financials are based on the most recent Mortgage that was taken out on this home.
Original Mortgage
$133,375
Outstanding Balance
$110,994
Interest Rate
3.95%
Mortgage Type
New Conventional
Estimated Equity
$168,667
Purchase Details
Closed on
May 16, 2008
Sold by
Wallick Thomas J
Bought by
Wallick Thomas J and Wallick Laura L
Home Financials for this Owner
Home Financials are based on the most recent Mortgage that was taken out on this home.
Original Mortgage
$136,000
Interest Rate
6.07%
Mortgage Type
New Conventional
Purchase Details
Closed on
Mar 7, 1991
Bought by
Wallick Thomas J
Create a Home Valuation Report for This Property
The Home Valuation Report is an in-depth analysis detailing your home's value as well as a comparison with similar homes in the area
Home Values in the Area
Average Home Value in this Area
Purchase History
| Date | Buyer | Sale Price | Title Company |
|---|---|---|---|
| Young Patricia Y | $1,375,000 | None Available | |
| Wallick Thomas J | -- | None Available | |
| Wallick Thomas J | $90,000 | -- |
Source: Public Records
Mortgage History
| Date | Status | Borrower | Loan Amount |
|---|---|---|---|
| Open | Young Patricia Y | $133,375 | |
| Previous Owner | Wallick Thomas J | $136,000 |
Source: Public Records
Tax History Compared to Growth
Tax History
| Year | Tax Paid | Tax Assessment Tax Assessment Total Assessment is a certain percentage of the fair market value that is determined by local assessors to be the total taxable value of land and additions on the property. | Land | Improvement |
|---|---|---|---|---|
| 2025 | $3,819 | $16,400 | $3,480 | $12,920 |
| 2024 | $3,819 | $16,400 | $3,480 | $12,920 |
| 2023 | $3,786 | $16,400 | $3,480 | $12,920 |
| 2022 | $3,786 | $16,400 | $3,480 | $12,920 |
| 2021 | $3,786 | $16,400 | $3,480 | $12,920 |
| 2020 | $3,892 | $16,400 | $3,480 | $12,920 |
| 2019 | $3,876 | $16,400 | $3,480 | $12,920 |
| 2018 | $3,876 | $16,400 | $3,480 | $12,920 |
| 2017 | $3,855 | $16,400 | $3,480 | $12,920 |
| 2016 | $3,855 | $16,400 | $3,480 | $12,920 |
| 2015 | -- | $16,400 | $3,480 | $12,920 |
| 2014 | -- | $16,400 | $3,480 | $12,920 |
Source: Public Records
Map
Nearby Homes
- 221 Cleveland St
- 243 Monroe St
- 16434 River View Cir
- 16442 River View Cir
- 16422 River View Cir
- 16352 River View Cir
- 16242 River View Cir
- 16344 River View Cir
- 16342 River View Cir
- 16322 River View Cir
- 16332 River View Cir
- 16131 River View Cir
- 16241 River View Cir
- 16232 River View Cir
- 16251 River View Cir
- 16453 River View Cir
- 16221 River View Cir
- 16231 River View Cir
- 16333 River View Cir
- 16223 River View Cir
- 1711 Benson Place
- 1715 Benson Place
- 1717 Benson Place
- 1709 Benson Place
- 1719 Benson Place
- 1721 Benson Place
- 1801 Benson Place
- 1803 Benson Place
- 1712 Benson Place
- 1805 Benson Place
- 1804 Wilson Ave
- 1807 Benson Place
- 221 Coolidge Place
- 245 Harrison St
- 243 Harrison St
- 1809 Benson Place
- 219 Coolidge Place
- 1808 Wilson Ave
- 1808 Wilson Ave
- 241 Harrison St