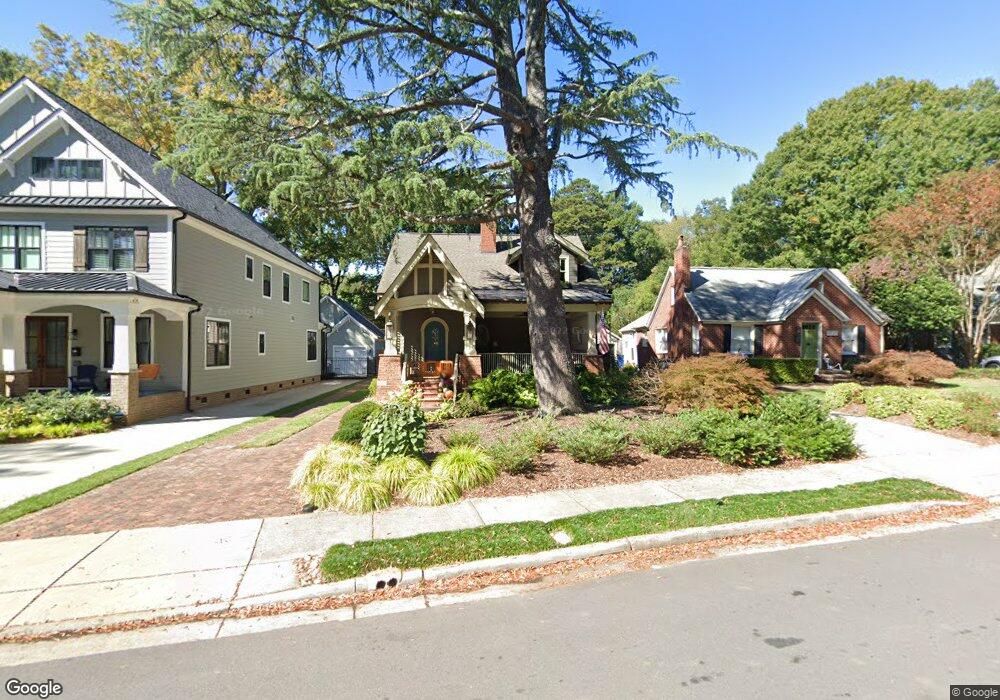
1713 Chatham Ave Charlotte, NC 28205
Plaza Midwood NeighborhoodEstimated Value: $1,270,000 - $1,420,000
3
Beds
4
Baths
2,949
Sq Ft
$467/Sq Ft
Est. Value
About This Home
This home is located at 1713 Chatham Ave, Charlotte, NC 28205 and is currently estimated at $1,376,791, approximately $466 per square foot. 1713 Chatham Ave is a home located in Mecklenburg County with nearby schools including Shamrock Gardens Elementary School, Eastway Middle School, and Garinger High School.
Ownership History
Date
Name
Owned For
Owner Type
Purchase Details
Closed on
Apr 1, 2022
Sold by
Lucas Cathy M and Lucas Lynn B
Bought by
Mcadams Edward Judson and Mcadams Lynne Settle
Current Estimated Value
Home Financials for this Owner
Home Financials are based on the most recent Mortgage that was taken out on this home.
Original Mortgage
$856,000
Outstanding Balance
$807,522
Interest Rate
4.67%
Mortgage Type
New Conventional
Estimated Equity
$569,269
Purchase Details
Closed on
Mar 18, 2022
Sold by
Opus Myers Park Llc
Bought by
Rogers Lynn B and Lucas Cathy Mae
Home Financials for this Owner
Home Financials are based on the most recent Mortgage that was taken out on this home.
Original Mortgage
$856,000
Outstanding Balance
$807,522
Interest Rate
4.67%
Mortgage Type
New Conventional
Estimated Equity
$569,269
Purchase Details
Closed on
Aug 8, 2007
Sold by
Lucas Cathy M and Lynn Rogers B
Bought by
Lucas Cathy M and Lynn Rogers B
Purchase Details
Closed on
Oct 2, 2006
Sold by
Lucas Cathy M
Bought by
Lucas Cathy M and Lynn Rogers B
Create a Home Valuation Report for This Property
The Home Valuation Report is an in-depth analysis detailing your home's value as well as a comparison with similar homes in the area
Home Values in the Area
Average Home Value in this Area
Purchase History
| Date | Buyer | Sale Price | Title Company |
|---|---|---|---|
| Mcadams Edward Judson | $1,265,000 | Doyle & Wallace Pllc | |
| Rogers Lynn B | $1,100,000 | Hazlehurst John L | |
| Lucas Cathy M | -- | None Available | |
| Lucas Cathy M | -- | None Available |
Source: Public Records
Mortgage History
| Date | Status | Borrower | Loan Amount |
|---|---|---|---|
| Open | Mcadams Edward Judson | $856,000 |
Source: Public Records
Tax History Compared to Growth
Tax History
| Year | Tax Paid | Tax Assessment Tax Assessment Total Assessment is a certain percentage of the fair market value that is determined by local assessors to be the total taxable value of land and additions on the property. | Land | Improvement |
|---|---|---|---|---|
| 2025 | $9,077 | $1,178,500 | $350,000 | $828,500 |
| 2024 | $9,077 | $1,178,500 | $350,000 | $828,500 |
| 2023 | $8,783 | $1,178,500 | $350,000 | $828,500 |
| 2022 | $6,458 | $656,200 | $275,000 | $381,200 |
| 2021 | $6,447 | $656,200 | $275,000 | $381,200 |
| 2020 | $6,439 | $656,200 | $275,000 | $381,200 |
| 2019 | $6,424 | $656,200 | $275,000 | $381,200 |
| 2018 | $7,150 | $539,400 | $162,000 | $377,400 |
| 2017 | $7,045 | $539,400 | $162,000 | $377,400 |
| 2016 | -- | $539,400 | $162,000 | $377,400 |
| 2015 | $7,024 | $539,400 | $162,000 | $377,400 |
| 2014 | $8,045 | $621,500 | $162,000 | $459,500 |
Source: Public Records
Map
Nearby Homes
- 2314 Wolfe St
- 1813 Kenwood Ave
- 1614 Chatham Ave
- 1615 Chatham Ave
- 1609 Chatham Ave
- 1625 Club Rd
- 1429 Landis Ave
- 1425 Landis Ave
- 1511 Landis Ave
- 1609 Onslow Dr
- 1904 Dearmon Dr
- 1304 Queen Lyon Ct
- 2115 Chatham Ave
- 1820 Kensington Dr
- 2021 Sablewood Dr
- 1421 Lyon Ct
- 1829 Logie Ave
- 1412 Lyon Ct
- 1808 Chestnut Ave
- 1709 Masonic Dr
- 1717 Chatham Ave
- 1709 Chatham Ave
- 1721 Chatham Ave
- 1705 Chatham Ave
- 1725 Chatham Ave
- 1701 Chatham Ave
- 1729 Chatham Ave
- 1712 Fulton Ave
- 1708 Fulton Ave
- 1704 Fulton Ave
- 1716 Fulton Ave
- 1700 Fulton Ave
- 1641 Chatham Ave
- 2304 Wolfe St
- 1716 Chatham Ave
- 1724 Fulton Ave
- 1712 Chatham Ave
- 2310 Roland St
- 1724 Chatham Ave
- 1708 Chatham Ave