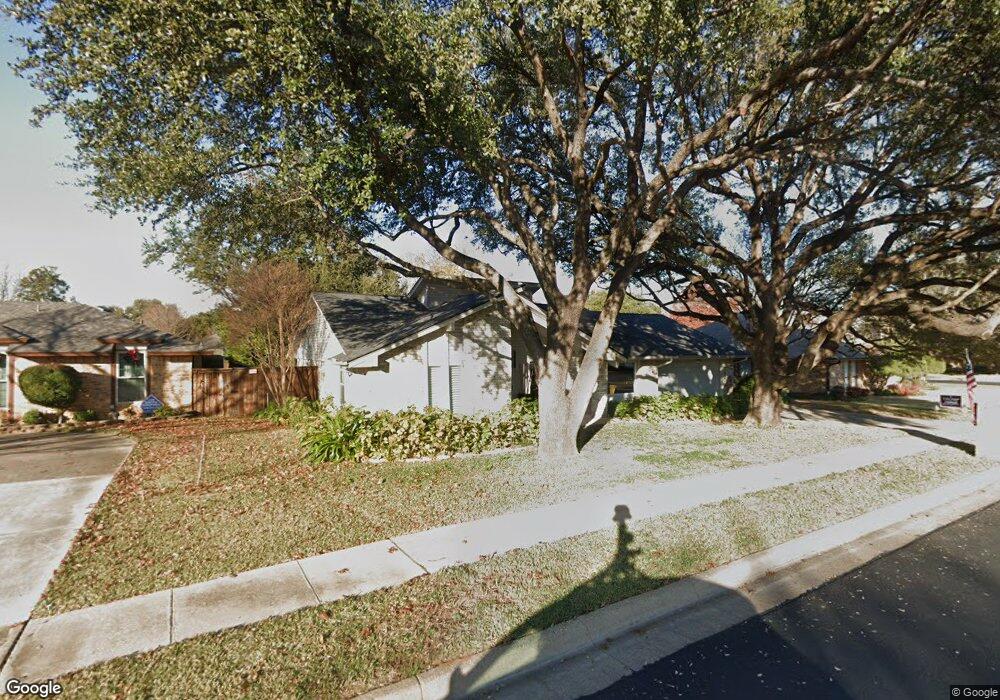
1713 Cunningham Ct Bedford, TX 76021
Estimated Value: $429,481 - $474,000
4
Beds
2
Baths
2,085
Sq Ft
$220/Sq Ft
Est. Value
About This Home
This home is located at 1713 Cunningham Ct, Bedford, TX 76021 and is currently estimated at $458,620, approximately $219 per square foot. 1713 Cunningham Ct is a home located in Tarrant County with nearby schools including Spring Garden Elementary School, Harwood Junior High School, and Trinity High School.
Ownership History
Date
Name
Owned For
Owner Type
Purchase Details
Closed on
Sep 1, 2006
Sold by
Prince Barry S and Prince Rebecca R
Bought by
Lynch Joseph M and King Sheridan
Current Estimated Value
Home Financials for this Owner
Home Financials are based on the most recent Mortgage that was taken out on this home.
Original Mortgage
$152,000
Outstanding Balance
$92,272
Interest Rate
6.87%
Mortgage Type
Purchase Money Mortgage
Estimated Equity
$366,348
Purchase Details
Closed on
Aug 21, 1996
Sold by
Kistner Kevin Charles and Kistner Elizabeth Ann
Bought by
Prince Barry S and Prince Rebecca R
Home Financials for this Owner
Home Financials are based on the most recent Mortgage that was taken out on this home.
Original Mortgage
$102,750
Interest Rate
8.24%
Create a Home Valuation Report for This Property
The Home Valuation Report is an in-depth analysis detailing your home's value as well as a comparison with similar homes in the area
Home Values in the Area
Average Home Value in this Area
Purchase History
| Date | Buyer | Sale Price | Title Company |
|---|---|---|---|
| Lynch Joseph M | -- | None Available | |
| Prince Barry S | -- | First American Title Co |
Source: Public Records
Mortgage History
| Date | Status | Borrower | Loan Amount |
|---|---|---|---|
| Open | Lynch Joseph M | $152,000 | |
| Previous Owner | Prince Barry S | $102,750 | |
| Closed | Prince Barry S | $20,550 |
Source: Public Records
Tax History Compared to Growth
Tax History
| Year | Tax Paid | Tax Assessment Tax Assessment Total Assessment is a certain percentage of the fair market value that is determined by local assessors to be the total taxable value of land and additions on the property. | Land | Improvement |
|---|---|---|---|---|
| 2025 | $4,010 | $386,000 | $85,000 | $301,000 |
| 2024 | $4,010 | $409,555 | $85,000 | $324,555 |
| 2023 | $7,058 | $408,766 | $60,000 | $348,766 |
| 2022 | $7,306 | $415,492 | $60,000 | $355,492 |
| 2021 | $7,164 | $304,111 | $60,000 | $244,111 |
| 2020 | $7,231 | $304,111 | $60,000 | $244,111 |
| 2019 | $6,880 | $290,000 | $60,000 | $230,000 |
| 2018 | $5,872 | $257,445 | $60,000 | $197,445 |
| 2017 | $5,925 | $296,083 | $40,000 | $256,083 |
| 2016 | $5,386 | $256,681 | $40,000 | $216,681 |
| 2015 | $4,808 | $202,400 | $25,000 | $177,400 |
| 2014 | $4,808 | $202,400 | $25,000 | $177,400 |
Source: Public Records
Map
Nearby Homes
- 1800 Hampton Dr
- 1636 Bedford Oaks Dr
- 1704 Indian Oaks Ct
- 3532 Meadowside Dr
- 3513 Meadowside Dr
- 1820 Wimbleton Dr
- 1723 Post Oak Dr
- 1630 Post Oak Dr
- 1209 Hillandale Ct
- 3301 Wendover Ct
- 2901 Miles Way
- 2209 Laurel Ct
- 3827 Ashbury Ln
- 1401 Danielle Dr
- 37 Devonshire Dr
- 22 Lincolnshire Cir
- 3840 Edgewater Dr
- 3813 Brookridge Ct
- 1136 Wingate Dr
- 2220 Tiffany Glenn Ct
- 1717 Cunningham Ct
- 1709 Cunningham Ct
- 1716 Arthurs Cir
- 1720 Arthurs Cir
- 3413 Norman Ln
- 1716 Cunningham Ct
- 1705 Cunningham Ct
- 1712 Arthurs Cir
- 3500 Norman Ln
- 3504 Norman Ln
- 3409 Norman Ln
- 3420 Norman Ln
- 1701 Cunningham Ct
- 1712 Cunningham Ct
- 3508 Norman Ln
- 1708 Arthurs Cir
- 3416 Norman Ln
- 1700 Cunningham Ct
- 3405 Norman Ln
- 1705 Arthurs Cir