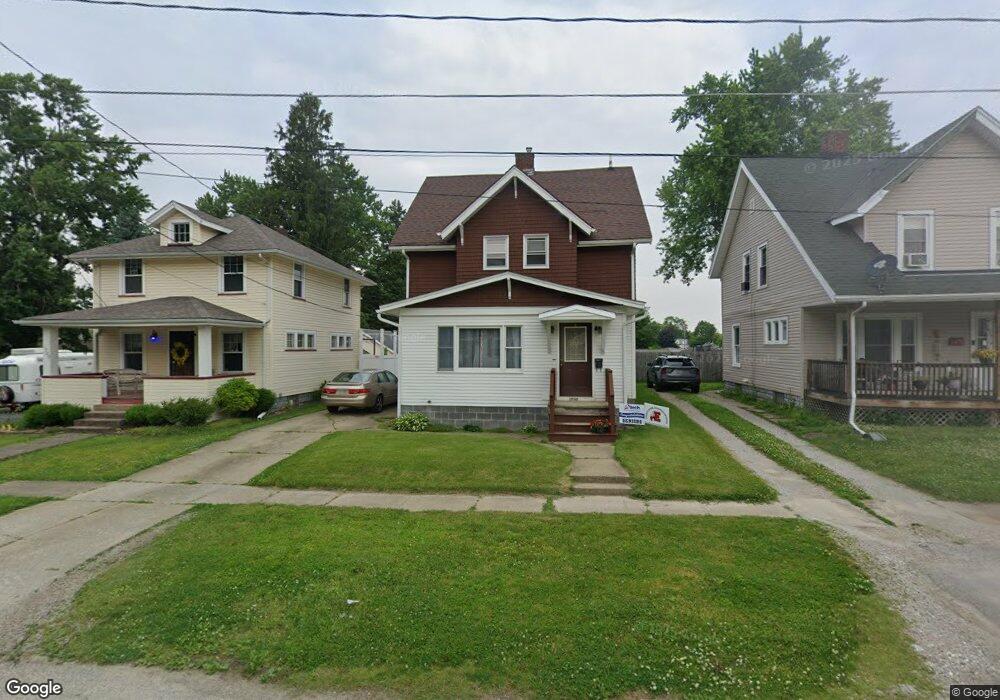
1713 E 36th St Ashtabula, OH 44004
Estimated Value: $104,000 - $194,000
3
Beds
2
Baths
1,710
Sq Ft
$84/Sq Ft
Est. Value
About This Home
This home is located at 1713 E 36th St, Ashtabula, OH 44004 and is currently estimated at $143,657, approximately $84 per square foot. 1713 E 36th St is a home located in Ashtabula County with nearby schools including Ridgeview Elementary School, Kingsville Elementary School, and Wallace H. Braden Junior High School.
Ownership History
Date
Name
Owned For
Owner Type
Purchase Details
Closed on
Sep 23, 2008
Sold by
Private Capital Group Llc
Bought by
Brobst Robert D and Brobst Stormie L
Current Estimated Value
Purchase Details
Closed on
Nov 14, 2007
Sold by
Bartone Alice and Bartone Nicholas
Bought by
Private Capital Group Llc
Purchase Details
Closed on
Nov 3, 2004
Sold by
Kindler Bonnie A
Bought by
Bartone Alice
Home Financials for this Owner
Home Financials are based on the most recent Mortgage that was taken out on this home.
Original Mortgage
$83,200
Interest Rate
6.25%
Mortgage Type
Unknown
Purchase Details
Closed on
Sep 16, 1994
Sold by
Capitena Charles A
Bought by
Kindler Bonnie
Home Financials for this Owner
Home Financials are based on the most recent Mortgage that was taken out on this home.
Original Mortgage
$37,000
Interest Rate
8.44%
Mortgage Type
New Conventional
Create a Home Valuation Report for This Property
The Home Valuation Report is an in-depth analysis detailing your home's value as well as a comparison with similar homes in the area
Home Values in the Area
Average Home Value in this Area
Purchase History
| Date | Buyer | Sale Price | Title Company |
|---|---|---|---|
| Brobst Robert D | $43,000 | Contemporary Title Solutions | |
| Private Capital Group Llc | $50,000 | None Available | |
| Bartone Alice | $104,000 | Sherman Title Agency Inc | |
| Kindler Bonnie | $72,000 | -- |
Source: Public Records
Mortgage History
| Date | Status | Borrower | Loan Amount |
|---|---|---|---|
| Previous Owner | Bartone Alice | $83,200 | |
| Previous Owner | Kindler Bonnie | $37,000 | |
| Closed | Bartone Alice | $20,800 |
Source: Public Records
Tax History
| Year | Tax Paid | Tax Assessment Tax Assessment Total Assessment is a certain percentage of the fair market value that is determined by local assessors to be the total taxable value of land and additions on the property. | Land | Improvement |
|---|---|---|---|---|
| 2024 | $2,567 | $29,050 | $2,940 | $26,110 |
| 2023 | $1,321 | $29,050 | $2,940 | $26,110 |
| 2022 | $1,101 | $20,900 | $2,240 | $18,660 |
| 2021 | $1,111 | $20,900 | $2,240 | $18,660 |
| 2020 | $1,111 | $20,900 | $2,240 | $18,660 |
| 2019 | $1,103 | $19,330 | $2,280 | $17,050 |
| 2018 | $1,069 | $19,330 | $2,280 | $17,050 |
| 2017 | $992 | $19,330 | $2,280 | $17,050 |
| 2016 | $1,245 | $23,280 | $2,730 | $20,550 |
| 2015 | $1,244 | $23,280 | $2,730 | $20,550 |
| 2014 | $1,213 | $23,280 | $2,730 | $20,550 |
| 2013 | $1,305 | $23,980 | $2,660 | $21,320 |
Source: Public Records
Map
Nearby Homes
- 4016 State Rd
- 3129 Lincoln Dr
- 4211 Birchwood Ave
- 2124 E 40th St
- 3024 Latimer Ave
- 4320 Birchwood Ave
- 3003 Blair Ave
- 3001 Blair Ave
- 4211 Park Ave
- 3033 Avon Blvd
- 4422 State Rd
- 4422 Rodgers Rd
- 2130 E 44th St
- 3835 Lake Ave
- 3829 Lake Ave
- 1629 E 47th St
- 1331 E 28th St
- 3038 Eureka Rd
- 505 W 36th St
- 3603 Silvieus Dr
- 1719 E 36th St
- 1723 E 36th St
- 3512 Luce Ave
- 1709 E 36th St
- 3508 Luce Ave
- 3504 Luce Ave
- 1801 E 36th St
- 1716 E 36th St
- 3500 Luce Ave
- 1802 E 36th St
- 3424 Luce Ave
- 1712 E 36th St
- 1806 E 36th St
- 3520 Willow Glen Dr
- 3529 Willow Glen Dr
- 3512 Willow Glen Dr
- 1800 E Prospect Rd
- 1704 E Prospect Rd
- 3519 State Rd
- 1708-1710 E Prospect- Rt 20 Rd E
Your Personal Tour Guide
Ask me questions while you tour the home.