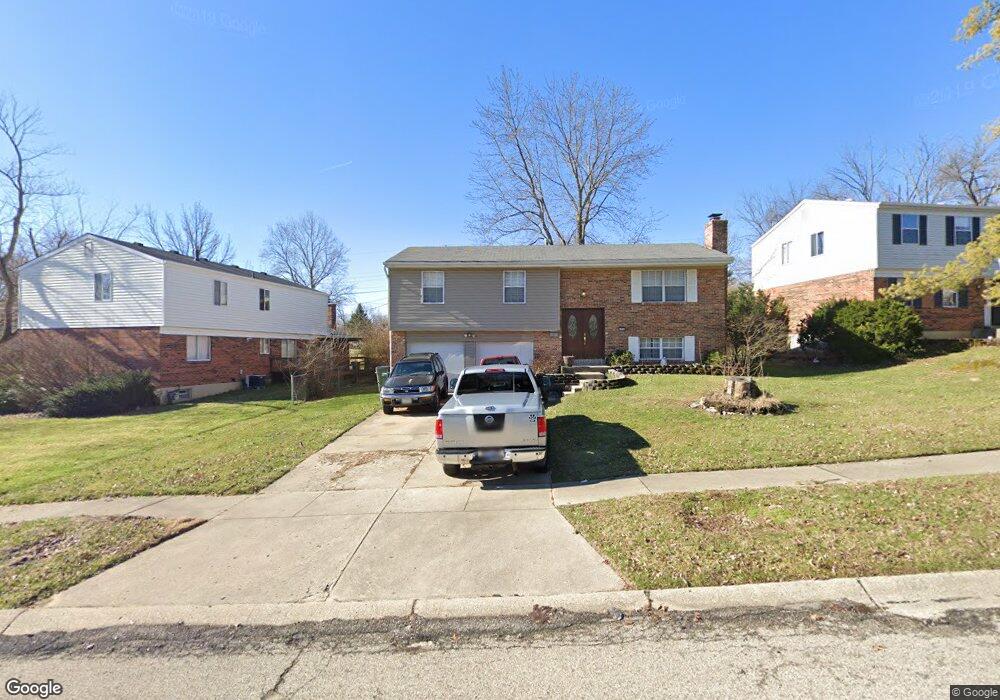
1713 Fallbrook Ln Cincinnati, OH 45240
Pleasant Run Farms NeighborhoodEstimated Value: $205,000 - $264,000
3
Beds
3
Baths
1,650
Sq Ft
$141/Sq Ft
Est. Value
About This Home
This home is located at 1713 Fallbrook Ln, Cincinnati, OH 45240 and is currently estimated at $232,983, approximately $141 per square foot. 1713 Fallbrook Ln is a home located in Hamilton County with nearby schools including Pleasant Run Elementary School, Pleasant Run Middle School, and Northwest High School.
Ownership History
Date
Name
Owned For
Owner Type
Purchase Details
Closed on
Mar 1, 2022
Sold by
Oaks Property Group Llc
Bought by
Aux Funding Llc
Current Estimated Value
Home Financials for this Owner
Home Financials are based on the most recent Mortgage that was taken out on this home.
Interest Rate
3.89%
Purchase Details
Closed on
Feb 28, 2022
Sold by
Oaks Property Group Llc
Bought by
Aux Funding Llc
Home Financials for this Owner
Home Financials are based on the most recent Mortgage that was taken out on this home.
Interest Rate
3.89%
Purchase Details
Closed on
Apr 16, 1994
Sold by
Wagner Dennis Victor and Wagner Leann
Bought by
Gruenemeier Kevin J and Gruenemeier Dawn R
Home Financials for this Owner
Home Financials are based on the most recent Mortgage that was taken out on this home.
Original Mortgage
$89,877
Interest Rate
7.84%
Mortgage Type
FHA
Create a Home Valuation Report for This Property
The Home Valuation Report is an in-depth analysis detailing your home's value as well as a comparison with similar homes in the area
Home Values in the Area
Average Home Value in this Area
Purchase History
| Date | Buyer | Sale Price | Title Company |
|---|---|---|---|
| Aux Funding Llc | $160,000 | -- | |
| Aux Funding Llc | -- | None Listed On Document | |
| Oaks Property Group Llc | $150,000 | Cutler Jay L | |
| Gruenemeier Kevin J | -- | -- |
Source: Public Records
Mortgage History
| Date | Status | Borrower | Loan Amount |
|---|---|---|---|
| Closed | Aux Funding Llc | -- | |
| Previous Owner | Gruenemeier Kevin J | $89,877 |
Source: Public Records
Tax History
| Year | Tax Paid | Tax Assessment Tax Assessment Total Assessment is a certain percentage of the fair market value that is determined by local assessors to be the total taxable value of land and additions on the property. | Land | Improvement |
|---|---|---|---|---|
| 2025 | $3,600 | $56,000 | $12,257 | $43,743 |
| 2023 | $3,348 | $56,000 | $12,257 | $43,743 |
| 2022 | $3,412 | $47,377 | $10,609 | $36,768 |
| 2021 | $3,377 | $47,377 | $10,609 | $36,768 |
| 2020 | $3,419 | $47,377 | $10,609 | $36,768 |
| 2019 | $2,890 | $37,902 | $8,488 | $29,414 |
| 2018 | $2,613 | $37,902 | $8,488 | $29,414 |
| 2017 | $2,481 | $37,902 | $8,488 | $29,414 |
| 2016 | $2,627 | $39,432 | $9,237 | $30,195 |
| 2015 | $2,656 | $39,432 | $9,237 | $30,195 |
| 2014 | $2,660 | $39,432 | $9,237 | $30,195 |
| 2013 | $2,644 | $40,237 | $9,426 | $30,811 |
Source: Public Records
Map
Nearby Homes
- 1759 John Gray Rd
- 1632 Forester Dr
- 11955 Mill Rd
- 1407 Graymont Ct
- 1 Pinehurst Ct
- 1944 Creswell Dr
- 1352 Forester Dr
- 2017 Broadhurst Ave
- 2150 Augusta Blvd
- 2344 Horning Dr
- 12080 Regency Run Ct Unit 4
- 12181 Regency Run Ct
- 12120 Regency Run Ct
- 2048 Woodtrail Dr
- 4 Pleasant Creek Ct
- 11995 Wincanton Dr
- 1535 Gelhot Dr
- 1555 Gelhot Dr
- 1610 Gelhot Dr
- 1570 Gelhot Dr
- 1721 Fallbrook Ln
- 12139 Elkwood Dr
- 12125 Elkwood Dr
- 1733 Fallbrook Ln
- 1714 Fullerton Dr
- 1710 Fallbrook Ln
- 1718 Fallbrook Ln
- 1724 Fallbrook Ln
- 12161 Elkwood Dr
- 1741 Fallbrook Ln
- 1722 Fullerton Dr
- 1732 Fallbrook Ln
- 12140 Elkwood Dr
- 12148 Elkwood Dr
- 12132 Elkwood Dr
- 12156 Elkwood Dr
- 1738 Fallbrook Ln
- 1749 Fallbrook Ln
- 12124 Elkwood Dr
- 1732 Fullerton Dr
Your Personal Tour Guide
Ask me questions while you tour the home.