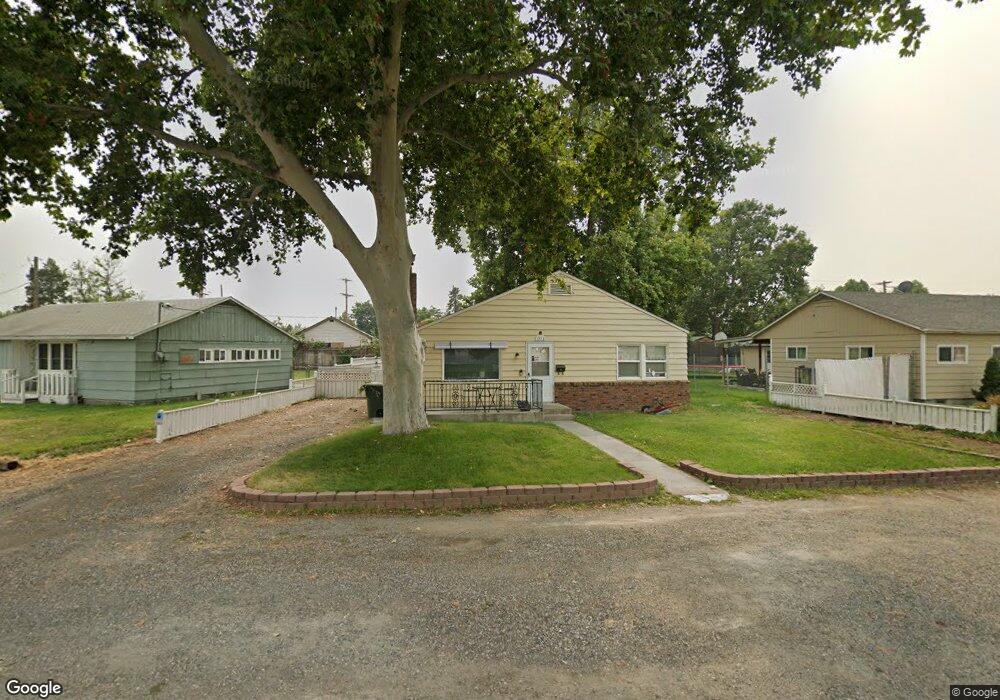
1713 Gray St Unit Well Maintained, Man Richland, WA 99352
Estimated Value: $304,000 - $334,000
3
Beds
1
Bath
1,152
Sq Ft
$278/Sq Ft
Est. Value
About This Home
This home is located at 1713 Gray St Unit Well Maintained, Man, Richland, WA 99352 and is currently estimated at $319,741, approximately $277 per square foot. 1713 Gray St Unit Well Maintained, Man is a home located in Benton County with nearby schools including Marcus Whitman Elementary School, Carmichael Middle School, and Richland High School.
Ownership History
Date
Name
Owned For
Owner Type
Purchase Details
Closed on
Sep 30, 2016
Sold by
Vancorbach Joel M and Van Corbach Nicole E
Bought by
Cox Phillip and Cox Sandle
Current Estimated Value
Home Financials for this Owner
Home Financials are based on the most recent Mortgage that was taken out on this home.
Original Mortgage
$64,101
Outstanding Balance
$51,389
Interest Rate
3.46%
Mortgage Type
Stand Alone Second
Estimated Equity
$268,352
Purchase Details
Closed on
Nov 13, 2014
Sold by
Norton Stephen D and Norton Shelley A
Bought by
Vancorbach Joel M and Van Corbach Nicole E
Home Financials for this Owner
Home Financials are based on the most recent Mortgage that was taken out on this home.
Original Mortgage
$116,831
Interest Rate
4.16%
Mortgage Type
New Conventional
Create a Home Valuation Report for This Property
The Home Valuation Report is an in-depth analysis detailing your home's value as well as a comparison with similar homes in the area
Home Values in the Area
Average Home Value in this Area
Purchase History
| Date | Buyer | Sale Price | Title Company |
|---|---|---|---|
| Cox Phillip | $163,000 | Benton Franklin Title Co | |
| Vancorbach Joel M | $127,267 | Frontier Title & Escrow Co |
Source: Public Records
Mortgage History
| Date | Status | Borrower | Loan Amount |
|---|---|---|---|
| Open | Cox Phillip | $64,101 | |
| Open | Cox Phillip | $160,047 | |
| Previous Owner | Vancorbach Joel M | $116,831 |
Source: Public Records
Tax History Compared to Growth
Tax History
| Year | Tax Paid | Tax Assessment Tax Assessment Total Assessment is a certain percentage of the fair market value that is determined by local assessors to be the total taxable value of land and additions on the property. | Land | Improvement |
|---|---|---|---|---|
| 2024 | $2,141 | $251,050 | $50,000 | $201,050 |
| 2023 | $2,141 | $226,430 | $50,000 | $176,430 |
| 2022 | $2,019 | $193,610 | $50,000 | $143,610 |
| 2021 | $1,818 | $181,300 | $50,000 | $131,300 |
| 2020 | $1,847 | $156,680 | $50,000 | $106,680 |
| 2019 | $1,526 | $150,660 | $24,000 | $126,660 |
| 2018 | $1,479 | $133,770 | $24,000 | $109,770 |
| 2017 | $1,296 | $108,440 | $24,000 | $84,440 |
| 2016 | $1,278 | $108,440 | $24,000 | $84,440 |
| 2015 | $1,302 | $108,440 | $24,000 | $84,440 |
| 2014 | -- | $108,440 | $24,000 | $84,440 |
| 2013 | -- | $108,440 | $24,000 | $84,440 |
Source: Public Records
Map
Nearby Homes
- 505 Winslow Ave
- 513 Winslow Ave
- 503 Wright Ave Unit B8
- 2120 Duportail St Unit 1
- 2109 Duportail St
- 626 Snow Ave
- 405 Basswood Ave
- 713 Sanford Ave
- 2305 Concord St
- 2402 Dover St
- 2404 Dallas St
- 2407 Duportail St
- 811 Wright Ave
- 302 Rossell Ave
- 910 Wright Ave
- 901 Cedar Ave
- 627 Cedar Ave
- 617 Cottonwood Dr
- 211 Wright Ave
- 1416 Agnes St
- 1713 Gray St Unit Spacious kitchen, fu
- 1713 Gray St
- 1715 Gray St
- 1711 Gray St
- 1710 Fries St
- 1712 Fries St
- 1707 Gray St
- 1708 Fries St
- 1705 Gray St
- 507 Winslow Ave
- 1706 Fries St
- 503 Winslow Ave
- 509 Winslow Ave
- 501 Winslow Ave
- 511 Winslow Ave
- 1703 Gray St
- 1704 Fries St
- 1711 Fries St
- 1709 Fries St
- 506 Wright Ave