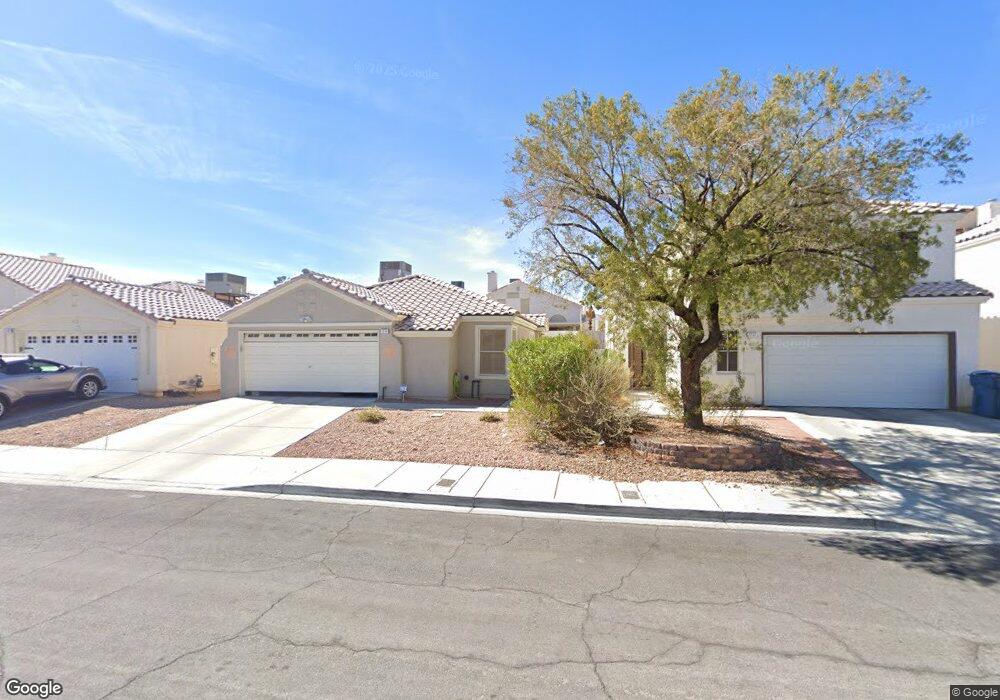
1713 Klamath Falls Way Las Vegas, NV 89128
Summerlin NeighborhoodEstimated Value: $375,911 - $388,000
3
Beds
2
Baths
1,322
Sq Ft
$289/Sq Ft
Est. Value
About This Home
This home is located at 1713 Klamath Falls Way, Las Vegas, NV 89128 and is currently estimated at $381,728, approximately $288 per square foot. 1713 Klamath Falls Way is a home located in Clark County with nearby schools including Edythe & Lloyd Katz Elementary School, James B. McMillan Elementary School, and Ernest Becker Middle School.
Ownership History
Date
Name
Owned For
Owner Type
Purchase Details
Closed on
Mar 16, 2011
Sold by
Freitag William and Freitag April
Bought by
Jalbert Dana Lynn
Current Estimated Value
Home Financials for this Owner
Home Financials are based on the most recent Mortgage that was taken out on this home.
Original Mortgage
$97,367
Outstanding Balance
$69,093
Interest Rate
5.5%
Mortgage Type
FHA
Estimated Equity
$312,635
Purchase Details
Closed on
Sep 22, 1993
Sold by
Lewis Homes Tenaya L P
Bought by
William Freitag and William April
Home Financials for this Owner
Home Financials are based on the most recent Mortgage that was taken out on this home.
Original Mortgage
$92,700
Interest Rate
7.21%
Mortgage Type
FHA
Create a Home Valuation Report for This Property
The Home Valuation Report is an in-depth analysis detailing your home's value as well as a comparison with similar homes in the area
Home Values in the Area
Average Home Value in this Area
Purchase History
| Date | Buyer | Sale Price | Title Company |
|---|---|---|---|
| Jalbert Dana Lynn | $99,900 | Ticor Title Las Vegas | |
| William Freitag | $100,200 | United Title |
Source: Public Records
Mortgage History
| Date | Status | Borrower | Loan Amount |
|---|---|---|---|
| Open | Jalbert Dana Lynn | $97,367 | |
| Previous Owner | William Freitag | $92,700 |
Source: Public Records
Tax History Compared to Growth
Tax History
| Year | Tax Paid | Tax Assessment Tax Assessment Total Assessment is a certain percentage of the fair market value that is determined by local assessors to be the total taxable value of land and additions on the property. | Land | Improvement |
|---|---|---|---|---|
| 2025 | $1,648 | $78,596 | $32,200 | $46,396 |
| 2024 | $1,601 | $78,596 | $32,200 | $46,396 |
| 2023 | $1,601 | $73,671 | $29,400 | $44,271 |
| 2022 | $1,629 | $65,568 | $24,850 | $40,718 |
| 2021 | $1,509 | $60,184 | $21,350 | $38,834 |
| 2020 | $1,398 | $59,326 | $20,650 | $38,676 |
| 2019 | $1,310 | $57,199 | $18,900 | $38,299 |
| 2018 | $1,250 | $51,391 | $14,350 | $37,041 |
| 2017 | $1,648 | $50,261 | $12,600 | $37,661 |
| 2016 | $1,171 | $48,028 | $10,150 | $37,878 |
| 2015 | $1,168 | $43,661 | $8,400 | $35,261 |
| 2014 | $1,134 | $33,807 | $6,300 | $27,507 |
Source: Public Records
Map
Nearby Homes
- 1724 Navajo Lake Way
- 1716 Klamath Falls Way
- 1809 Pacific Terrace Dr Unit 2
- 1620 Palmae Way
- 1600 Palmales Ct Unit 2
- 1636 Royal Palm Dr
- 1617 Night Breeze Dr
- 7405 Saybrook Point Dr
- 1830 N Buffalo Dr Unit 2083
- 1830 N Buffalo Dr Unit 2115
- 1830 N Buffalo Dr Unit 2014
- 1830 N Buffalo Dr Unit 2024
- 1830 N Buffalo Dr Unit 2043
- 1830 N Buffalo Dr Unit 2084
- 7212 Indian Path Cir
- 7325 Lattimore Dr
- 7324 Braswell Dr
- 1904 Leaning Pine Way
- 1737 Pomerado Dr
- 1332 Wheatland Way
- 1709 Klamath Falls Way
- 1717 Klamath Falls Way
- 1705 Klamath Falls Way
- 1721 Klamath Falls Way
- 1716 Navajo Lake Way
- 1712 Navajo Lake Way
- 1720 Navajo Lake Way
- 1725 Klamath Falls Way
- 1708 Navajo Lake Way
- 1701 Klamath Falls Way
- 1712 Klamath Falls Way
- 1704 Navajo Lake Way
- 1708 Klamath Falls Way
- 1729 Klamath Falls Way
- 1728 Navajo Lake Way
- 1720 Klamath Falls Way
- 1704 Klamath Falls Way
- 1724 Klamath Falls Way
- 1732 Navajo Lake Way
- 1700 Klamath Falls Way