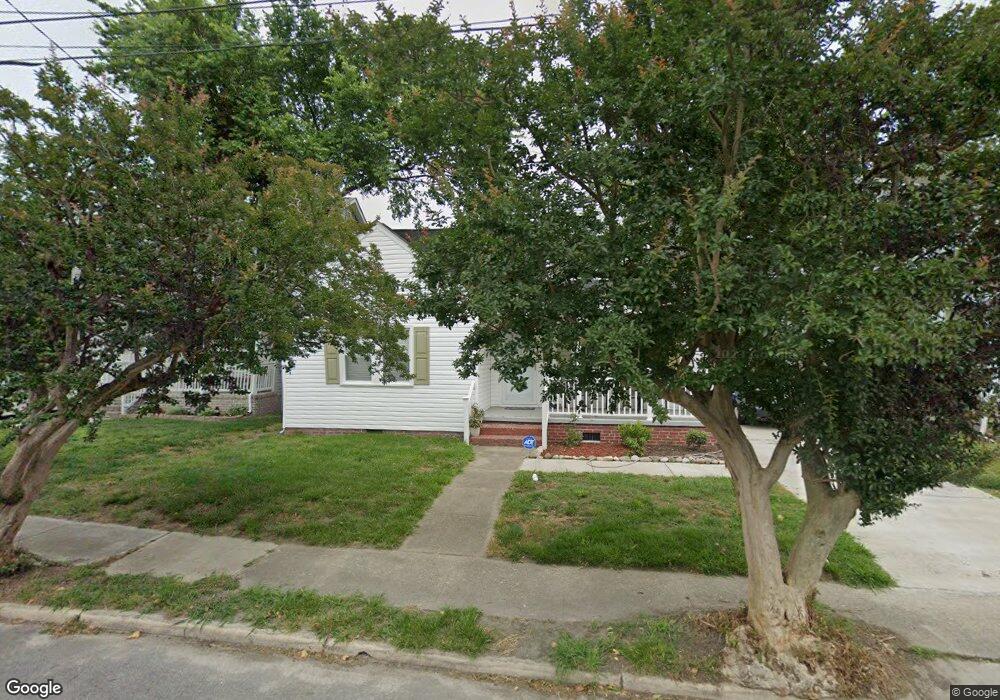
1713 Maple Ave Portsmouth, VA 23704
South Portsmouth NeighborhoodEstimated Value: $246,644 - $291,000
3
Beds
2
Baths
1,572
Sq Ft
$169/Sq Ft
Est. Value
About This Home
This home is located at 1713 Maple Ave, Portsmouth, VA 23704 and is currently estimated at $265,661, approximately $168 per square foot. 1713 Maple Ave is a home located in Portsmouth City with nearby schools including Brighton Elementary School, Manor High School, and Court Street Academy.
Ownership History
Date
Name
Owned For
Owner Type
Purchase Details
Closed on
Jul 18, 2022
Sold by
Blue Julia L and Calello Tyler S
Bought by
Tincher Nicholas A
Current Estimated Value
Home Financials for this Owner
Home Financials are based on the most recent Mortgage that was taken out on this home.
Original Mortgage
$250,635
Outstanding Balance
$238,397
Interest Rate
5.23%
Mortgage Type
VA
Estimated Equity
$27,264
Purchase Details
Closed on
May 12, 2020
Sold by
Ward Earl P and Ward Blount
Bought by
Blue Julia L and Caiello Tyler S
Home Financials for this Owner
Home Financials are based on the most recent Mortgage that was taken out on this home.
Original Mortgage
$171,352
Interest Rate
3.3%
Mortgage Type
VA
Purchase Details
Closed on
Sep 28, 2018
Sold by
Teh Estate Of Daisy Brown Charles
Bought by
Ward Earl P and Blount-Ward Keisha C
Create a Home Valuation Report for This Property
The Home Valuation Report is an in-depth analysis detailing your home's value as well as a comparison with similar homes in the area
Home Values in the Area
Average Home Value in this Area
Purchase History
| Date | Buyer | Sale Price | Title Company |
|---|---|---|---|
| Tincher Nicholas A | $245,000 | Priority Title | |
| Blue Julia L | $167,500 | Alpha 1 Title & Escrow Llc | |
| Ward Earl P | $10,000 | Attorney |
Source: Public Records
Mortgage History
| Date | Status | Borrower | Loan Amount |
|---|---|---|---|
| Open | Tincher Nicholas A | $250,635 | |
| Previous Owner | Blue Julia L | $171,352 |
Source: Public Records
Tax History Compared to Growth
Tax History
| Year | Tax Paid | Tax Assessment Tax Assessment Total Assessment is a certain percentage of the fair market value that is determined by local assessors to be the total taxable value of land and additions on the property. | Land | Improvement |
|---|---|---|---|---|
| 2025 | $2,844 | $217,300 | $54,690 | $162,610 |
| 2024 | $2,844 | $217,300 | $54,690 | $162,610 |
| 2023 | $2,624 | $209,900 | $54,690 | $155,210 |
| 2022 | $2,164 | $166,430 | $43,750 | $122,680 |
| 2021 | $1,861 | $143,190 | $31,660 | $111,530 |
| 2020 | $1,726 | $132,750 | $30,150 | $102,600 |
| 2019 | $1,254 | $96,490 | $30,150 | $66,340 |
| 2018 | $1,254 | $96,490 | $30,150 | $66,340 |
| 2017 | $1,206 | $92,800 | $30,150 | $62,650 |
| 2016 | $1,206 | $92,800 | $30,150 | $62,650 |
| 2015 | $1,206 | $92,800 | $30,150 | $62,650 |
| 2014 | $1,179 | $92,800 | $30,150 | $62,650 |
Source: Public Records
Map
Nearby Homes
- 1623 Prentis Ave
- 1621 Elm Ave
- 1906 Lasalle Ave
- 1520 Prentis Ave
- 101 Gilmerton Ave
- 1703 Camden Ave
- 1918 Prentis Ave
- 1438 Lasalle Ave
- 1908 Elm Ave
- 1919 Camden Ave
- 1902 Camden Ave
- 2008 Elm Ave
- 2107 Pearl St
- 1601 Atlanta Ave
- 2111 Pearl St
- 2124 Pearl St
- 2010 Camden Ave
- 2000 Effingham St
- 1121 Fayette St
- 2211 Peach St
- 1701 Maple Ave
- 1717 Maple Ave
- 1708 Lasalle Ave
- 1627 Maple Ave
- 1700 Lasalle Ave
- 1700 Maple Ave
- 1712 Maple Ave
- 1716 Lasalle Ave
- 1720 Maple Ave
- 1725 Maple Ave
- 1718 Lasalle Ave
- 1724 Maple Ave
- 1618 Lasalle Ave
- 1618 Lasalle Ave
- 1628 Maple Ave
- 1728 Maple Ave
- 1731 Maple Ave
- 1722 Lasalle Ave
- 1619 Maple Ave
- 1427 Lasalle Ave