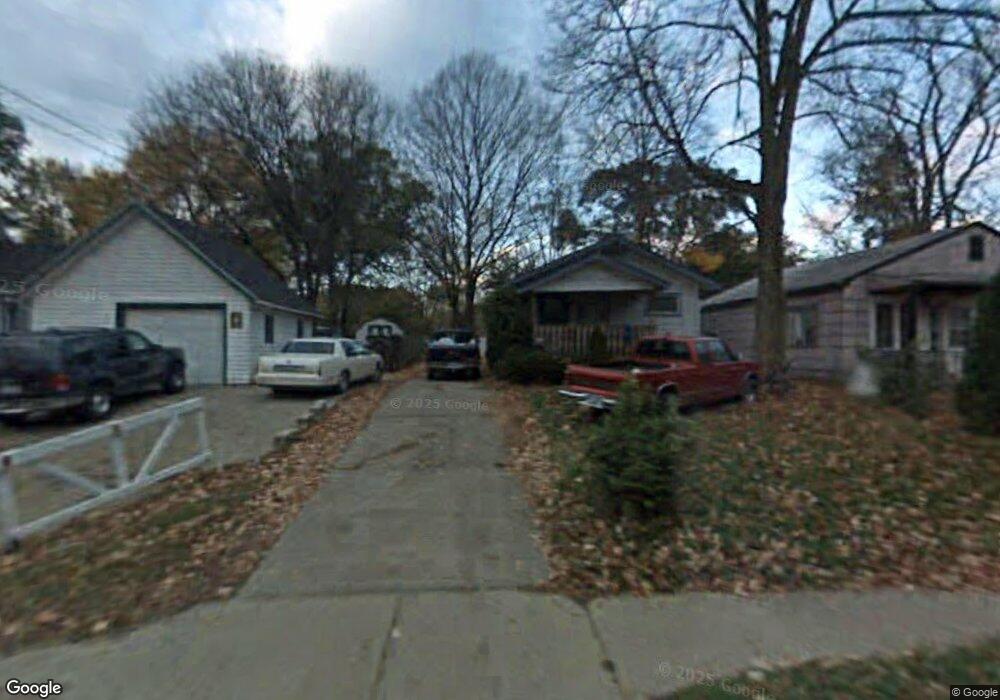
1713 N Martin Luther King Junior Blvd Lansing, MI 48915
Bassett Park NeighborhoodEstimated Value: $64,000 - $96,000
2
Beds
1
Bath
780
Sq Ft
$100/Sq Ft
Est. Value
About This Home
This home is located at 1713 N Martin Luther King Junior Blvd, Lansing, MI 48915 and is currently estimated at $78,065, approximately $100 per square foot. 1713 N Martin Luther King Junior Blvd is a home located in Ingham County with nearby schools including Willow School, Pattengill Academy, and J.W. Sexton High School.
Ownership History
Date
Name
Owned For
Owner Type
Purchase Details
Closed on
Jun 17, 2019
Sold by
Ingham Cnty Land Bk Fast Track Authority
Bought by
Williams James
Current Estimated Value
Purchase Details
Closed on
Dec 6, 2017
Sold by
Ingham County
Bought by
Ingham County Land Bank Fast Track Autho
Purchase Details
Closed on
Dec 5, 2017
Sold by
Schertzing Eric
Bought by
The City Of Ingham
Purchase Details
Closed on
Sep 11, 2009
Sold by
Bermudez Ygnacio and Bermudez Olivia
Bought by
Us Bank National Association
Purchase Details
Closed on
Jul 30, 2009
Sold by
Bermudez Ygnacio L and Bermudez Olivia L
Bought by
U S Bank National Association
Purchase Details
Closed on
Nov 24, 2003
Sold by
Calkins Ruth A
Bought by
Bermudez Ygnacio and Bermudez Olivia
Create a Home Valuation Report for This Property
The Home Valuation Report is an in-depth analysis detailing your home's value as well as a comparison with similar homes in the area
Home Values in the Area
Average Home Value in this Area
Purchase History
| Date | Buyer | Sale Price | Title Company |
|---|---|---|---|
| Williams James | -- | Dba Capital Fund Title Svcs | |
| Ingham County Land Bank Fast Track Autho | -- | None Available | |
| The City Of Ingham | -- | None Available | |
| Us Bank National Association | $3,000 | None Available | |
| U S Bank National Association | $12,960 | None Available | |
| Bermudez Ygnacio | $29,000 | Bell Title Company |
Source: Public Records
Tax History Compared to Growth
Tax History
| Year | Tax Paid | Tax Assessment Tax Assessment Total Assessment is a certain percentage of the fair market value that is determined by local assessors to be the total taxable value of land and additions on the property. | Land | Improvement |
|---|---|---|---|---|
| 2025 | $368 | $3,000 | $3,000 | $0 |
| 2024 | $2 | $3,000 | $3,000 | $0 |
| 2023 | $361 | $3,000 | $3,000 | $0 |
| 2022 | $355 | $3,100 | $3,100 | $0 |
| 2021 | $401 | $3,700 | $3,700 | $0 |
| 2020 | $402 | $3,700 | $3,700 | $0 |
| 2019 | $1,129 | $0 | $0 | $0 |
| 2018 | $1,129 | $15,100 | $3,700 | $11,400 |
| 2017 | $4,452 | $15,100 | $3,700 | $11,400 |
| 2016 | $1,552 | $14,900 | $3,700 | $11,200 |
| 2015 | $1,552 | $14,500 | $7,399 | $7,101 |
| 2014 | $1,552 | $15,100 | $10,000 | $5,100 |
Source: Public Records
Map
Nearby Homes
- 1616 Roseneath Ave
- 1537 Roselawn Ave
- 1430 N Martin Luther King jr Blvd
- 1422 Redwood St
- 1432 Redwood St
- 1620 Comfort St
- 1320 Glenrose Ave
- 1327 N Jenison Ave
- 1224 Theodore St
- 1129 N Martin Luther King jr Blvd
- 1300 W Maple St
- 1310 W Maple St
- 406 Pleasant St
- 3021 N Grand River Ave
- 1900 Kaplan St
- 336 W Gier St
- 1019 Daleford St
- 423 W César E Chávez Ave
- 624 Brook St
- 415 Filley St
- 1713 N Mlk Blvd
- 1713 N Martin Luther King jr Blvd
- 1715 N Martin Luther King jr Blvd
- 1705 N Mlk Blvd
- 1715 N Mlk Blvd
- 1717 N Mlk Blvd
- 1635 N Mlk Blvd
- 1635 N Martin Luther King jr Blvd
- 1710 Robertson Ave
- 1714 Robertson Ave
- 1706 Robertson Ave
- 1718 Robertson Ave
- 1704 Robertson Ave
- 1631 N Martin Luther King Junior Blvd
- 1631 N Mlk Blvd
- 1720 Robertson Ave
- 1714 N Martin Luther King jr Blvd
- 1632 Robertson Ave
- 1706 N Mlk Blvd