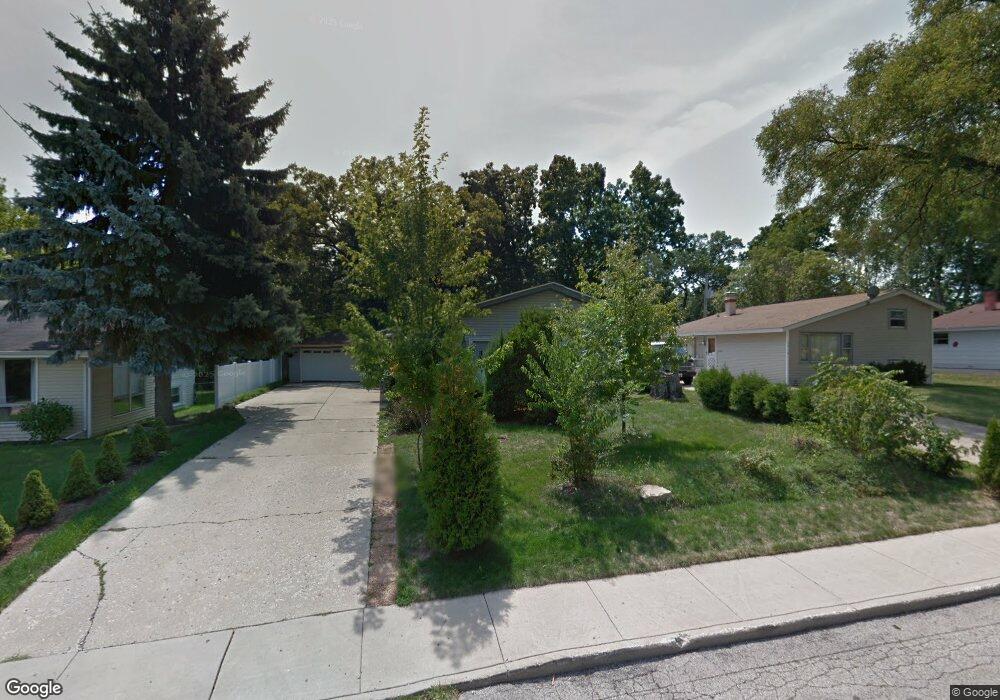
1713 Queens Ct Carpentersville, IL 60110
Estimated Value: $247,000 - $298,000
3
Beds
1
Bath
1,073
Sq Ft
$258/Sq Ft
Est. Value
About This Home
This home is located at 1713 Queens Ct, Carpentersville, IL 60110 and is currently estimated at $276,620, approximately $257 per square foot. 1713 Queens Ct is a home located in Kane County with nearby schools including Lakewood School, Crescent City Grade School, and Carpentersville Middle School.
Ownership History
Date
Name
Owned For
Owner Type
Purchase Details
Closed on
Apr 1, 2024
Sold by
Nieto Baltazar Gonzalez and Hernandez Ana Maria
Bought by
Your New Life Home 1713 Queens A Protected Se
Current Estimated Value
Purchase Details
Closed on
Jul 22, 2011
Sold by
Secretary Of Housing & Urban Development
Bought by
Gonzalez Baltazar
Purchase Details
Closed on
Sep 13, 2010
Sold by
Lopez Alberto and Lopez Fernando
Bought by
The Secretary Of Housing & Urban Develop
Purchase Details
Closed on
Mar 15, 2005
Sold by
Canaday Carl Ray and Canaday Joanne J
Bought by
Lopez Alberto and Lopez Fernando
Home Financials for this Owner
Home Financials are based on the most recent Mortgage that was taken out on this home.
Original Mortgage
$181,437
Interest Rate
5.67%
Mortgage Type
Purchase Money Mortgage
Create a Home Valuation Report for This Property
The Home Valuation Report is an in-depth analysis detailing your home's value as well as a comparison with similar homes in the area
Home Values in the Area
Average Home Value in this Area
Purchase History
| Date | Buyer | Sale Price | Title Company |
|---|---|---|---|
| Your New Life Home 1713 Queens A Protected Se | -- | None Listed On Document | |
| Gonzalez Baltazar | -- | Stewart Title Company | |
| The Secretary Of Housing & Urban Develop | -- | None Available | |
| Lopez Alberto | $184,000 | -- |
Source: Public Records
Mortgage History
| Date | Status | Borrower | Loan Amount |
|---|---|---|---|
| Previous Owner | Lopez Alberto | $181,437 |
Source: Public Records
Tax History Compared to Growth
Tax History
| Year | Tax Paid | Tax Assessment Tax Assessment Total Assessment is a certain percentage of the fair market value that is determined by local assessors to be the total taxable value of land and additions on the property. | Land | Improvement |
|---|---|---|---|---|
| 2024 | $5,887 | $77,728 | $12,553 | $65,175 |
| 2023 | $5,876 | $69,937 | $11,295 | $58,642 |
| 2022 | $5,347 | $61,408 | $11,295 | $50,113 |
| 2021 | $5,252 | $57,982 | $10,665 | $47,317 |
| 2020 | $4,630 | $56,678 | $10,425 | $46,253 |
| 2019 | $4,523 | $53,805 | $9,897 | $43,908 |
| 2018 | $4,623 | $52,588 | $9,701 | $42,887 |
| 2017 | $4,431 | $49,194 | $9,075 | $40,119 |
| 2016 | $4,064 | $42,940 | $8,787 | $34,153 |
| 2015 | -- | $37,097 | $8,234 | $28,863 |
| 2014 | -- | $33,066 | $8,007 | $25,059 |
| 2013 | -- | $34,078 | $8,252 | $25,826 |
Source: Public Records
Map
Nearby Homes
- 1426 Kings Rd
- 105 Siesta Rd
- 171 Lake Shore Dr
- 140 Hickory Dr
- 200 Amarillo Dr
- 149 Austin Ave
- 181 Skyline Dr
- 103 Hickory Dr
- 327 Tulsa Ave
- 7 Austin Ave
- 308 Amarillo Ct
- 4 Austin Ave
- 57 Robin Rd
- 1040 Rosewood Dr
- 1317 Brookdale Dr
- 494 Rosewood Dr
- 2013 Silverstone Dr Unit 2013
- 944 Cortney Dr
- 7 Hickory Dr
- 1431 Silverstone Dr Unit 1416
- 1711 Queens Ct
- 1715 Queens Ct
- 1717 Queens Ct
- 1712 Queens Ct
- 1714 Queens Ct
- 1710 Queens Ct
- 1719 Queens Ct
- 1716 Queens Ct
- 1706 Queens Ct
- 1718 Queens Ct
- 1519 Amarillo Dr
- 1521 Amarillo Dr
- 1720 Queens Ct
- 1517 Amarillo Dr
- 1523 Amarillo Dr
- 1515 Amarillo Dr
- 1703 Queens Ct
- 1525 Amarillo Dr
- 1701 Queens Ct
- 1722 Queens Ct