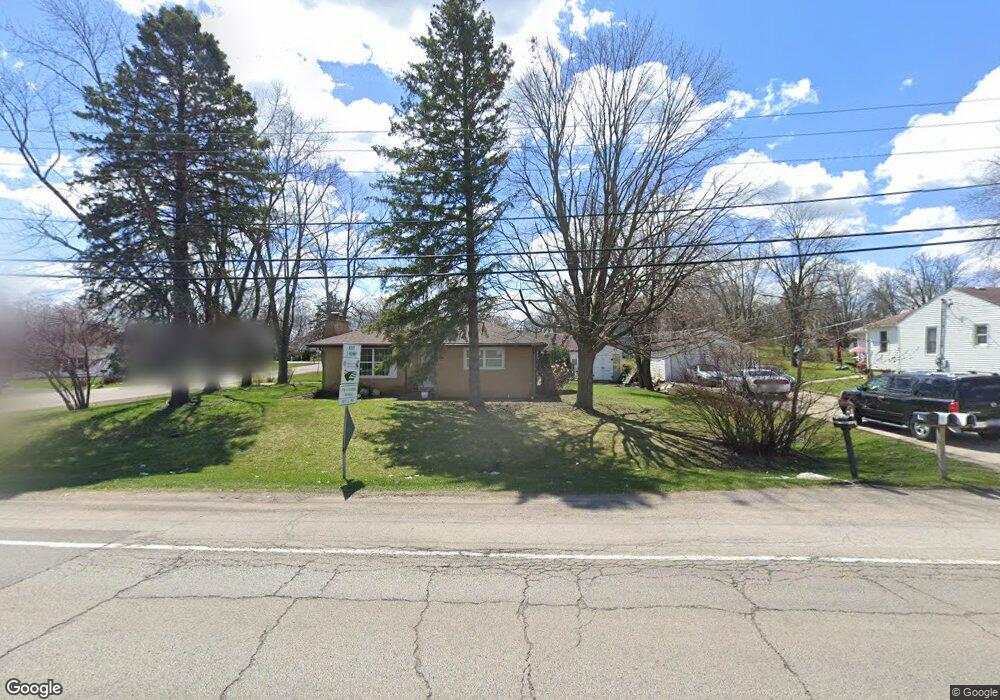
1713 W Yorkhouse Rd Waukegan, IL 60087
Lake County Gardens NeighborhoodEstimated Value: $264,000 - $301,000
4
Beds
2
Baths
1,704
Sq Ft
$167/Sq Ft
Est. Value
About This Home
This home is located at 1713 W Yorkhouse Rd, Waukegan, IL 60087 and is currently estimated at $284,294, approximately $166 per square foot. 1713 W Yorkhouse Rd is a home located in Lake County with nearby schools including H R McCall Elementary School, Jack Benny Middle School, and Waukegan High School.
Ownership History
Date
Name
Owned For
Owner Type
Purchase Details
Closed on
Jan 8, 2024
Sold by
Rim Properties Llc
Bought by
Rim Properties Llc Series 1713 Yorkhouse
Current Estimated Value
Purchase Details
Closed on
May 27, 2014
Sold by
Fonseca Roberto and Fonseca Martha
Bought by
Rim Properties Llc
Purchase Details
Closed on
Jan 20, 2011
Sold by
Wells Fargo Financial Illinois Inc
Bought by
Fonseca Roberto and Fonseca Martha
Purchase Details
Closed on
Sep 29, 2010
Sold by
Schattl Darrel J and Schattl Darrel
Bought by
Wells Fargo Financial Illinois Inc
Create a Home Valuation Report for This Property
The Home Valuation Report is an in-depth analysis detailing your home's value as well as a comparison with similar homes in the area
Home Values in the Area
Average Home Value in this Area
Purchase History
| Date | Buyer | Sale Price | Title Company |
|---|---|---|---|
| Rim Properties Llc Series 1713 Yorkhouse | -- | None Listed On Document | |
| Rim Properties Llc | -- | None Available | |
| Fonseca Roberto | $65,000 | First American Title | |
| Wells Fargo Financial Illinois Inc | -- | None Available |
Source: Public Records
Tax History Compared to Growth
Tax History
| Year | Tax Paid | Tax Assessment Tax Assessment Total Assessment is a certain percentage of the fair market value that is determined by local assessors to be the total taxable value of land and additions on the property. | Land | Improvement |
|---|---|---|---|---|
| 2024 | $6,997 | $82,882 | $16,316 | $66,566 |
| 2023 | $6,572 | $74,204 | $14,608 | $59,596 |
| 2022 | $6,572 | $67,229 | $12,002 | $55,227 |
| 2021 | $5,816 | $55,786 | $9,768 | $46,018 |
| 2020 | $5,891 | $51,971 | $9,100 | $42,871 |
| 2019 | $5,932 | $47,623 | $8,339 | $39,284 |
| 2018 | $6,797 | $52,549 | $8,430 | $44,119 |
| 2017 | $6,616 | $46,491 | $7,458 | $39,033 |
| 2016 | $6,246 | $40,399 | $6,481 | $33,918 |
| 2015 | $6,108 | $36,158 | $5,801 | $30,357 |
| 2014 | $3,576 | $21,134 | $4,563 | $16,571 |
| 2012 | $4,431 | $22,897 | $4,944 | $17,953 |
Source: Public Records
Map
Nearby Homes
- 37966 N Cornell Rd
- 3211 Rugby Ct
- 3411 N Lewis Ave
- 1636 Rice St
- 1612 Whitney St
- 38127 N Shore Ave
- 37905 N Loyola Ave
- 38362 N Manor Ave
- 3101 Country Club Ln
- 2613 N Lewis Ave
- 1730 W Beach Rd
- 38683 N Lewis Ave
- 38697 N Cedar Ave
- 2350 N Lewis Ave
- 12312 W Audrey Ave
- 11345 W Carnahan Ave
- 10241 W Bairstow Ave
- 2708 Dana Ave
- 2705 Dana Ave
- 11342-11364 W Wadsworth Rd
- 1719 W Yorkhouse Rd
- 1709 W Yorkhouse Rd
- 3128 Cornell Rd
- 3124 Cornell Rd Unit E
- 3124 Cornell Rd Unit W
- 3124 Cornell Rd
- 3124 N Cornell Rd
- 1712 W Yorkhouse Rd
- 1704 W Yorkhouse Rd
- 3120 Cornell Rd
- 1716 W Yorkhouse Rd
- 3204 Cornell Rd
- 3141 Cornell Rd
- 3116 Cornell Rd
- 3131 Cornell Rd
- 3209 Charleston Rd
- 3127 Cornell Rd
- 3208 Cornell Rd
- 1818 W Yorkhouse Rd
- 3203 Cornell Rd