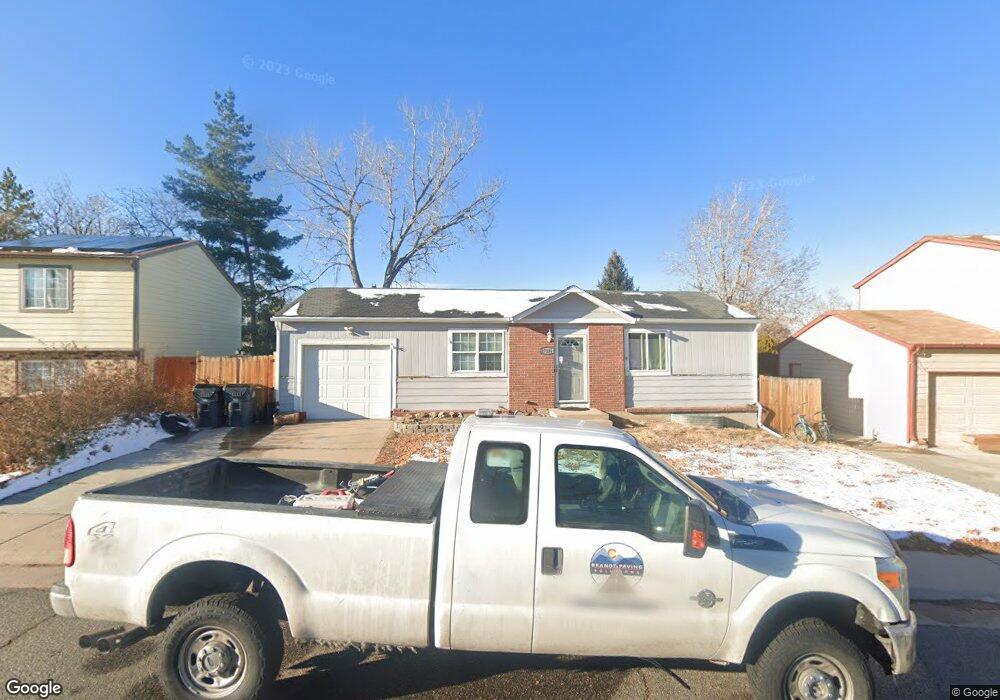
17131 E Mercer Dr Aurora, CO 80013
Carriage Place NeighborhoodEstimated Value: $412,016 - $448,000
3
Beds
2
Baths
1,676
Sq Ft
$260/Sq Ft
Est. Value
About This Home
This home is located at 17131 E Mercer Dr, Aurora, CO 80013 and is currently estimated at $436,254, approximately $260 per square foot. 17131 E Mercer Dr is a home located in Arapahoe County with nearby schools including Cimarron Elementary School, Horizon Middle School, and Smoky Hill High School.
Ownership History
Date
Name
Owned For
Owner Type
Purchase Details
Closed on
Feb 23, 2009
Sold by
Secretary Of Veterans Affairs
Bought by
Morrison Eric D
Current Estimated Value
Home Financials for this Owner
Home Financials are based on the most recent Mortgage that was taken out on this home.
Original Mortgage
$100,732
Outstanding Balance
$62,224
Interest Rate
4.92%
Mortgage Type
FHA
Estimated Equity
$374,030
Purchase Details
Closed on
Aug 28, 2008
Sold by
Siemer Troy D and Countrywide Home Loans Inc
Bought by
The Secretary Of Veterans Affairs
Purchase Details
Closed on
Feb 25, 2002
Sold by
Johnson Michael and Johnson Yong Ok
Bought by
Siemer Troy Dean
Home Financials for this Owner
Home Financials are based on the most recent Mortgage that was taken out on this home.
Original Mortgage
$171,360
Interest Rate
6.81%
Mortgage Type
VA
Purchase Details
Closed on
May 1, 1981
Sold by
Conversion Arapco
Bought by
Conversion Arapco
Purchase Details
Closed on
Jul 4, 1776
Bought by
Conversion Arapco
Create a Home Valuation Report for This Property
The Home Valuation Report is an in-depth analysis detailing your home's value as well as a comparison with similar homes in the area
Home Values in the Area
Average Home Value in this Area
Purchase History
| Date | Buyer | Sale Price | Title Company |
|---|---|---|---|
| Morrison Eric D | $106,000 | Fahtco | |
| The Secretary Of Veterans Affairs | $150,225 | None Available | |
| Siemer Troy Dean | $168,000 | -- | |
| Conversion Arapco | -- | -- | |
| Conversion Arapco | -- | -- |
Source: Public Records
Mortgage History
| Date | Status | Borrower | Loan Amount |
|---|---|---|---|
| Open | Morrison Eric D | $100,732 | |
| Previous Owner | Siemer Troy Dean | $171,360 |
Source: Public Records
Tax History
| Year | Tax Paid | Tax Assessment Tax Assessment Total Assessment is a certain percentage of the fair market value that is determined by local assessors to be the total taxable value of land and additions on the property. | Land | Improvement |
|---|---|---|---|---|
| 2025 | $2,302 | $26,688 | -- | -- |
| 2024 | $2,030 | $29,346 | -- | -- |
| 2023 | $2,030 | $29,346 | $0 | $0 |
| 2022 | $1,580 | $21,816 | $0 | $0 |
| 2021 | $1,590 | $21,816 | $0 | $0 |
| 2020 | $1,618 | $22,537 | $0 | $0 |
| 2019 | $1,561 | $22,537 | $0 | $0 |
| 2018 | $1,139 | $15,451 | $0 | $0 |
| 2017 | $1,123 | $15,451 | $0 | $0 |
| 2016 | $934 | $12,051 | $0 | $0 |
| 2015 | $889 | $12,051 | $0 | $0 |
| 2014 | $735 | $8,828 | $0 | $0 |
| 2013 | -- | $8,790 | $0 | $0 |
Source: Public Records
Map
Nearby Homes
- 3984 S Pitkin Way
- 4054 S Quintero Way
- 16897 E Napa Dr
- 17212 E Oberlin Place
- 4108 S Richfield St
- 17301 E Mansfield Ave Unit 122L
- 16656 E Mansfield Cir
- 4010 S Rifle Way
- 4218 S Richfield St
- 17493 E Mansfield Ave Unit 1231L
- 17473 E Mansfield Ave Unit 112WL
- 17595 E Mansfield Ave Unit 1331L
- 17595 E Mansfield Ave Unit 1312R
- 4247 S Pitkin St
- 17361 E Mansfield Ave Unit 532R
- 17361 E Mansfield Ave Unit 512L
- 16907 E Kent Dr
- 3955 S Nucla St
- 3868 S Nucla St
- 17657 E Loyola Dr Unit D
- 17151 E Mercer Dr
- 3938 S Pitkin Way
- 17161 E Mercer Dr
- 3940 S Pitkin Way
- 3936 S Pitkin Way
- 3944 S Pitkin Way
- 17111 E Mercer Dr
- 17132 E Mercer Dr
- 3930 S Pitkin Way
- 3954 S Pitkin Way
- 17191 E Mercer Dr
- 17162 E Mercer Dr
- 3964 S Pitkin Way
- 17122 E Mercer Dr
- 17101 E Mercer Dr
- 17142 E Mercer Dr
- 17114 E Mercer Dr
- 3939 S Pitkin Way
- 3937 S Pitkin Way
Your Personal Tour Guide
Ask me questions while you tour the home.