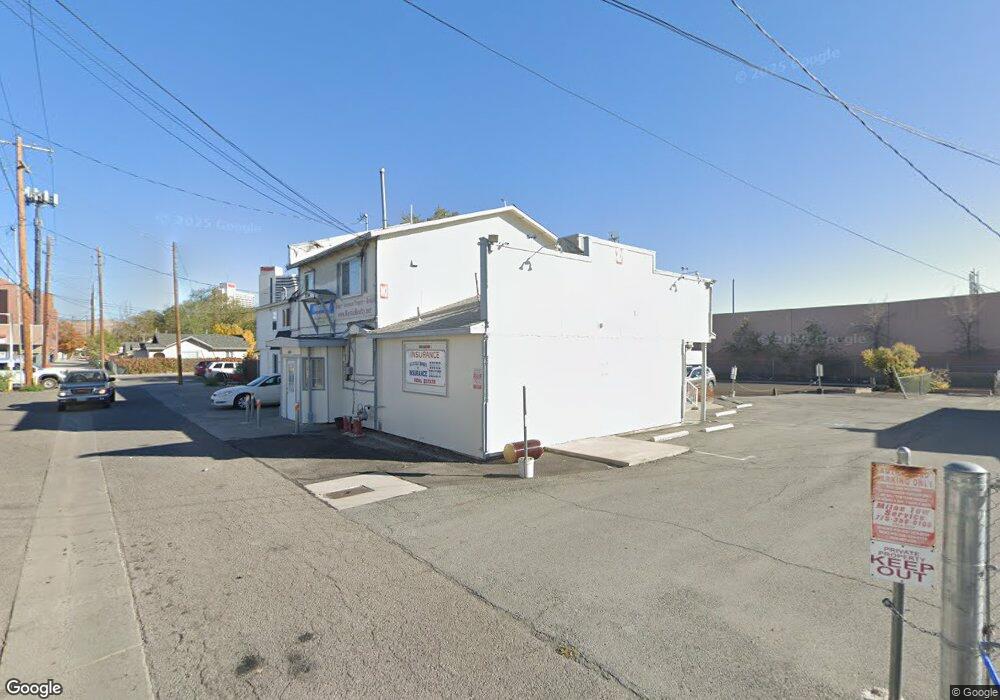
1714 A St Sparks, NV 89431
Downtown Sparks NeighborhoodEstimated Value: $430,623
2
Beds
1
Bath
2,358
Sq Ft
$183/Sq Ft
Est. Value
About This Home
This home is located at 1714 A St, Sparks, NV 89431 and is currently estimated at $430,623, approximately $182 per square foot. 1714 A St is a home located in Washoe County with nearby schools including Robert Mitchell Elementary School, Sparks Middle School, and Sparks High School.
Ownership History
Date
Name
Owned For
Owner Type
Purchase Details
Closed on
Apr 20, 2015
Sold by
Melching Steven M
Bought by
Melching Steven M and Melching Yvonne S
Current Estimated Value
Purchase Details
Closed on
Mar 27, 1997
Sold by
Ferguson Donna
Bought by
Melching Steven M
Home Financials for this Owner
Home Financials are based on the most recent Mortgage that was taken out on this home.
Original Mortgage
$115,000
Outstanding Balance
$14,531
Interest Rate
7.63%
Mortgage Type
Seller Take Back
Estimated Equity
$416,092
Purchase Details
Closed on
Mar 26, 1997
Sold by
Schultz R L and Schultz Nadene
Bought by
Melching Steven M
Home Financials for this Owner
Home Financials are based on the most recent Mortgage that was taken out on this home.
Original Mortgage
$115,000
Outstanding Balance
$14,531
Interest Rate
7.63%
Mortgage Type
Seller Take Back
Estimated Equity
$416,092
Purchase Details
Closed on
Jan 17, 1997
Sold by
Montgomery Robert and Montgomery Margaret
Bought by
Hubbart James E and Hubbart Sharon I
Create a Home Valuation Report for This Property
The Home Valuation Report is an in-depth analysis detailing your home's value as well as a comparison with similar homes in the area
Home Values in the Area
Average Home Value in this Area
Purchase History
| Date | Buyer | Sale Price | Title Company |
|---|---|---|---|
| Melching Steven M | -- | First Centennial Title Co | |
| Melching Steven M | -- | Stewart Title | |
| Melching Steven M | $115,000 | Stewart Title | |
| Hubbart James E | $1,000 | First Centennial Title Co |
Source: Public Records
Mortgage History
| Date | Status | Borrower | Loan Amount |
|---|---|---|---|
| Open | Melching Steven M | $115,000 |
Source: Public Records
Tax History Compared to Growth
Tax History
| Year | Tax Paid | Tax Assessment Tax Assessment Total Assessment is a certain percentage of the fair market value that is determined by local assessors to be the total taxable value of land and additions on the property. | Land | Improvement |
|---|---|---|---|---|
| 2025 | $2,422 | $70,412 | $13,035 | $57,377 |
| 2024 | $2,422 | $71,146 | $11,663 | $59,483 |
| 2023 | $2,234 | $64,157 | $10,291 | $53,866 |
| 2022 | $2,069 | $56,089 | $10,291 | $45,798 |
| 2021 | $2,009 | $54,419 | $8,919 | $45,500 |
| 2020 | $2,101 | $57,412 | $8,919 | $48,493 |
| 2019 | $2,001 | $54,307 | $8,233 | $46,074 |
| 2018 | $2,013 | $54,574 | $8,233 | $46,341 |
| 2017 | $2,055 | $55,732 | $8,233 | $47,499 |
| 2016 | $2,086 | $56,580 | $8,233 | $48,347 |
| 2015 | $2,124 | $57,592 | $8,233 | $49,359 |
| 2014 | $2,080 | $56,445 | $8,233 | $48,212 |
| 2013 | -- | $55,588 | $8,233 | $47,355 |
Source: Public Records
Map
Nearby Homes