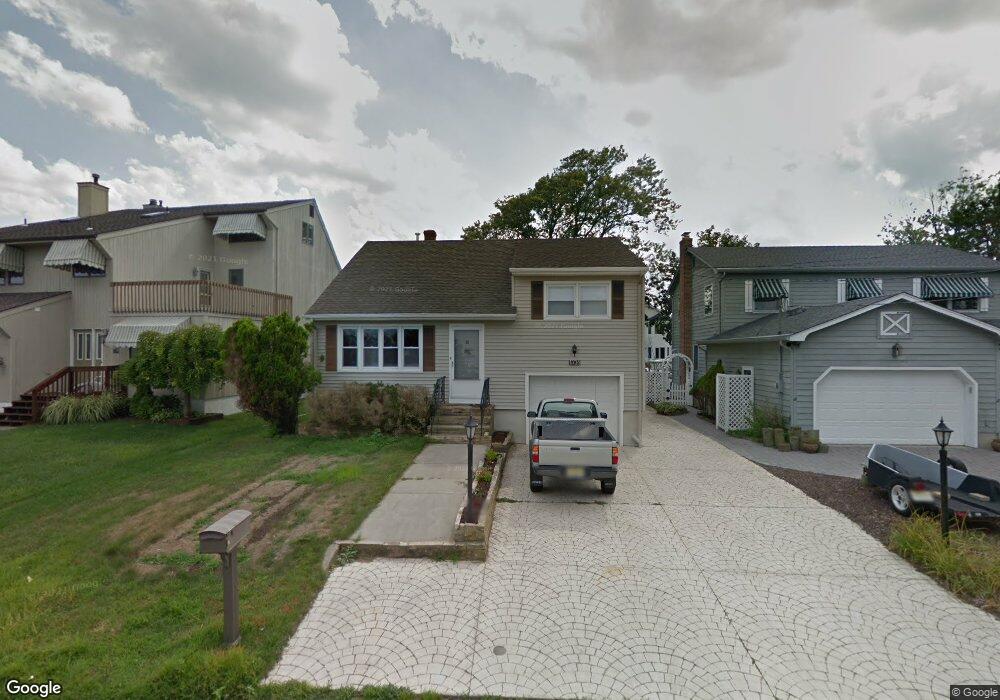
1714 Anchor Ct Point Pleasant Boro, NJ 08742
Estimated Value: $1,048,335 - $1,230,000
4
Beds
2
Baths
1,584
Sq Ft
$719/Sq Ft
Est. Value
About This Home
This home is located at 1714 Anchor Ct, Point Pleasant Boro, NJ 08742 and is currently estimated at $1,139,334, approximately $719 per square foot. 1714 Anchor Ct is a home located in Ocean County with nearby schools including Point Pleasant High School, St Dominic School, and St. Peter School.
Ownership History
Date
Name
Owned For
Owner Type
Purchase Details
Closed on
May 11, 2011
Sold by
Haynes Karen S
Bought by
Shoeman Rosalie
Current Estimated Value
Home Financials for this Owner
Home Financials are based on the most recent Mortgage that was taken out on this home.
Original Mortgage
$353,500
Outstanding Balance
$245,666
Interest Rate
4.88%
Mortgage Type
New Conventional
Estimated Equity
$893,668
Create a Home Valuation Report for This Property
The Home Valuation Report is an in-depth analysis detailing your home's value as well as a comparison with similar homes in the area
Home Values in the Area
Average Home Value in this Area
Purchase History
| Date | Buyer | Sale Price | Title Company |
|---|---|---|---|
| Shoeman Rosalie | $505,000 | None Available |
Source: Public Records
Mortgage History
| Date | Status | Borrower | Loan Amount |
|---|---|---|---|
| Open | Shoeman Rosalie | $353,500 |
Source: Public Records
Tax History Compared to Growth
Tax History
| Year | Tax Paid | Tax Assessment Tax Assessment Total Assessment is a certain percentage of the fair market value that is determined by local assessors to be the total taxable value of land and additions on the property. | Land | Improvement |
|---|---|---|---|---|
| 2025 | $11,321 | $495,000 | $400,000 | $95,000 |
| 2024 | $10,821 | $495,000 | $400,000 | $95,000 |
| 2023 | $10,598 | $495,000 | $400,000 | $95,000 |
| 2022 | $10,598 | $495,000 | $400,000 | $95,000 |
| 2021 | $10,435 | $495,000 | $400,000 | $95,000 |
| 2020 | $10,326 | $495,000 | $400,000 | $95,000 |
| 2019 | $10,187 | $495,000 | $400,000 | $95,000 |
| 2018 | $9,885 | $495,000 | $400,000 | $95,000 |
| 2017 | $9,667 | $495,000 | $400,000 | $95,000 |
| 2016 | $9,593 | $495,000 | $400,000 | $95,000 |
| 2015 | $9,479 | $495,000 | $400,000 | $95,000 |
| 2014 | $9,261 | $495,000 | $400,000 | $95,000 |
Source: Public Records
Map
Nearby Homes
- 1730 Bay Blvd
- 1720 Riviera Ct
- 1700 Rue Mirador
- 1421 Rue Mirador
- 704 Mount Place
- 1731 Bay Isle Dr
- 212 Howe St
- 674 Lake Ave
- 608 Lake Ave
- 141 Maple Dr
- 1800 Boat Point Dr
- 709 Howe St
- 230 Bridge Ave
- 1819 Boat Point Dr
- 634 East Ave
- 21 Mount St Unit 4A
- 21 Mount St Unit C1
- 551 East Ave
- 767 East Ave
- 525 East Ave
- 1712 Anchor Ct
- 1716 Anchor Ct
- 1718 Anchor Ct
- 1710 Anchor Ct
- 1720 Anchor Ct
- 1736 Anchor Ct
- 1733 Bay Blvd
- 1731 Bay Blvd
- 1706 Anchor Ct
- 1735 Bay Blvd
- 1722 Anchor Ct
- 1732 Anchor Ct
- 1709 Anchor Ct
- 1727 Bay Blvd
- 1737 Bay Blvd
- 1738 Anchor Ct
- 1704 Anchor Ct
- 1739 Bay Blvd
- 1724 Anchor Ct
- 1722 Perch Hole Point Place