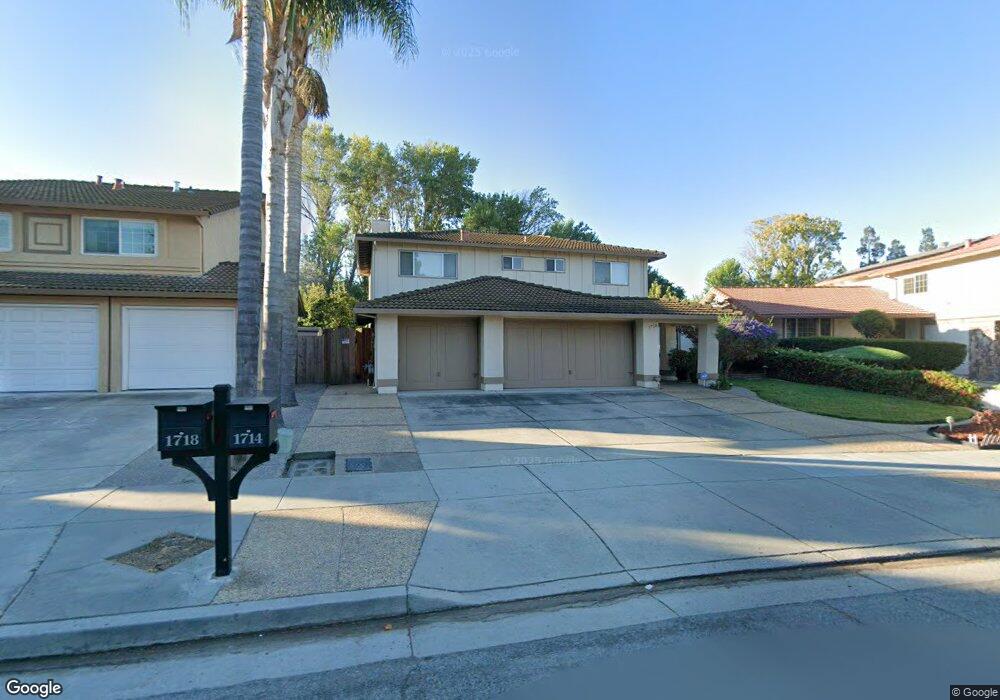
1714 Commodore Dr San Jose, CA 95133
Commodore NeighborhoodEstimated Value: $1,731,000 - $1,830,000
5
Beds
3
Baths
2,533
Sq Ft
$702/Sq Ft
Est. Value
About This Home
This home is located at 1714 Commodore Dr, San Jose, CA 95133 and is currently estimated at $1,778,103, approximately $701 per square foot. 1714 Commodore Dr is a home located in Santa Clara County with nearby schools including Vinci Park Elementary School, Piedmont Middle School, and Independence High School.
Ownership History
Date
Name
Owned For
Owner Type
Purchase Details
Closed on
May 23, 2006
Sold by
Tung Tricia and Tung Tricia Chu Sheau
Bought by
Tung Tricia and Tung Trust
Current Estimated Value
Purchase Details
Closed on
Dec 5, 2003
Sold by
Shin Chen Hwa
Bought by
Tung Tricia Chu Sheau
Home Financials for this Owner
Home Financials are based on the most recent Mortgage that was taken out on this home.
Original Mortgage
$170,000
Interest Rate
6%
Mortgage Type
Purchase Money Mortgage
Purchase Details
Closed on
Nov 20, 2003
Sold by
Tung Tricia Chu Sheau
Bought by
Shin Chen Hwa and Tung Tricia Chu Sheau
Home Financials for this Owner
Home Financials are based on the most recent Mortgage that was taken out on this home.
Original Mortgage
$170,000
Interest Rate
6%
Mortgage Type
Purchase Money Mortgage
Purchase Details
Closed on
Mar 4, 1999
Sold by
Shin Chen Hwa and Tung Chun Sheau T
Bought by
Tung Tricia Chu Sheau
Create a Home Valuation Report for This Property
The Home Valuation Report is an in-depth analysis detailing your home's value as well as a comparison with similar homes in the area
Home Values in the Area
Average Home Value in this Area
Purchase History
| Date | Buyer | Sale Price | Title Company |
|---|---|---|---|
| Tung Tricia | -- | None Available | |
| Tung Tricia Chu Sheau | -- | -- | |
| Shin Chen Hwa | -- | Stewart Title Of California | |
| Tung Tricia Chu Sheau | -- | -- |
Source: Public Records
Mortgage History
| Date | Status | Borrower | Loan Amount |
|---|---|---|---|
| Closed | Shin Chen Hwa | $170,000 |
Source: Public Records
Tax History
| Year | Tax Paid | Tax Assessment Tax Assessment Total Assessment is a certain percentage of the fair market value that is determined by local assessors to be the total taxable value of land and additions on the property. | Land | Improvement |
|---|---|---|---|---|
| 2025 | $8,547 | $572,580 | $206,408 | $366,172 |
| 2024 | $8,547 | $561,354 | $202,361 | $358,993 |
| 2023 | $8,380 | $550,348 | $198,394 | $351,954 |
| 2022 | $8,342 | $539,557 | $194,504 | $345,053 |
| 2021 | $8,060 | $528,979 | $190,691 | $338,288 |
| 2020 | $7,802 | $523,556 | $188,736 | $334,820 |
| 2019 | $7,503 | $513,291 | $185,036 | $328,255 |
| 2018 | $7,391 | $503,227 | $181,408 | $321,819 |
| 2017 | $7,426 | $493,360 | $177,851 | $315,509 |
| 2016 | $7,115 | $483,687 | $174,364 | $309,323 |
| 2015 | $7,029 | $476,422 | $171,745 | $304,677 |
| 2014 | $6,386 | $467,090 | $168,381 | $298,709 |
Source: Public Records
Map
Nearby Homes
- 1682 Commodore Dr
- 1901 Nevets Ln
- 1923 Nevets Ln
- 1712 Heavenly Bamboo Ct
- 688 Squire Ave
- 1809 Sable Place
- 1889 Sable Place
- 621 Blackbury Ln
- 1985 Mahuron Cir
- 1863 Dobbin Dr
- 783 Opie Ct
- 1131 Chen St
- 1011 Giacomo Ln Unit 1
- 1573 de Rome Dr Unit 1
- 12280 Mabury Rd
- 1146 Rosebriar Way
- 1038 Giacomo Ln
- 1013 Onofrio Ln Unit 2
- 1021 Onofrio Ln Unit 3
- 1153 Rosebriar Way
- 1718 Commodore Dr
- 1710 Commodore Dr
- 1722 Commodore Dr
- 1704 Commodore Dr
- 905 Cape Buffalo Dr
- 906 Cape Canaveral Place
- 1726 Commodore Dr
- 1698 Commodore Dr
- 1711 Cape Horn Ct
- 909 Cape Buffalo Dr
- 912 Cape Canaveral Place
- 1730 Commodore Dr
- 1692 Commodore Dr
- 1715 Cape Horn Ct
- 913 Cape Buffalo Dr
- 1734 Commodore Dr
- 904 Cape Buffalo Dr
- 1686 Commodore Dr
- 918 Cape Canaveral Place
- 907 Cape Canaveral Place
Your Personal Tour Guide
Ask me questions while you tour the home.