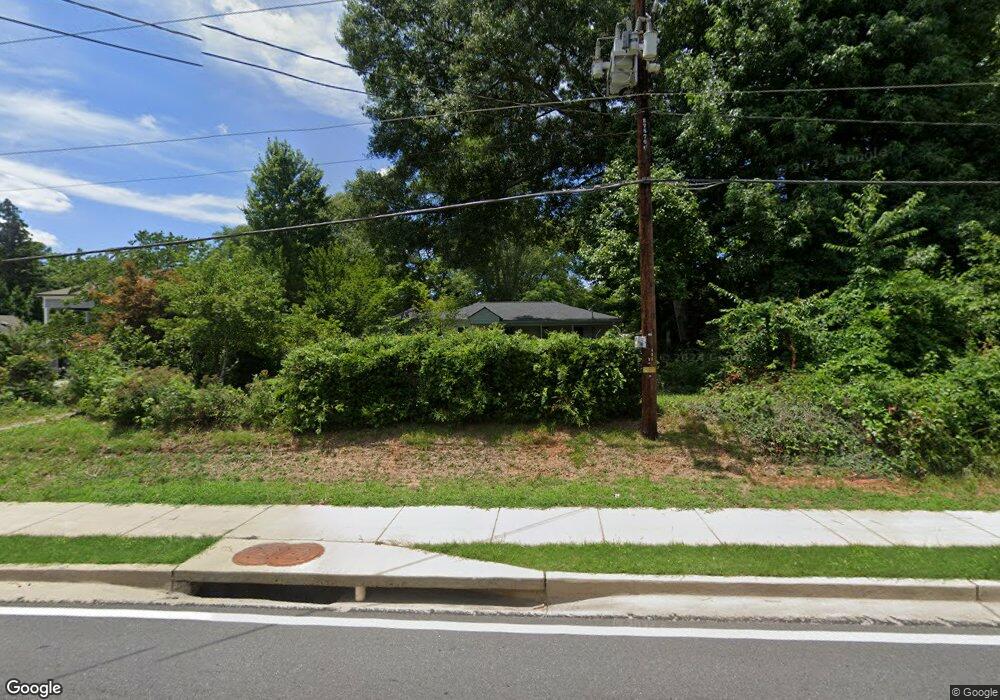
1714 Cooledge Rd Tucker, GA 30084
Estimated Value: $273,802 - $349,000
3
Beds
3
Baths
1,437
Sq Ft
$218/Sq Ft
Est. Value
About This Home
This home is located at 1714 Cooledge Rd, Tucker, GA 30084 and is currently estimated at $312,951, approximately $217 per square foot. 1714 Cooledge Rd is a home located in DeKalb County with nearby schools including Brockett Elementary School, Tucker Middle School, and Tucker High School.
Ownership History
Date
Name
Owned For
Owner Type
Purchase Details
Closed on
Feb 25, 2004
Sold by
Sullivan Francis C
Bought by
Sullivan Lydia D
Current Estimated Value
Purchase Details
Closed on
Jul 13, 2001
Sold by
Andrieni Fred
Bought by
Sullivan Francis C
Home Financials for this Owner
Home Financials are based on the most recent Mortgage that was taken out on this home.
Original Mortgage
$104,000
Interest Rate
7.16%
Mortgage Type
New Conventional
Purchase Details
Closed on
Aug 28, 2000
Sold by
S & A Holdings Inc
Bought by
Andrieni Fred
Purchase Details
Closed on
Jul 5, 2000
Sold by
Richardson Louise
Bought by
S & A Holdings Inc
Purchase Details
Closed on
Feb 11, 1998
Sold by
Giles Doris Estelle Haynie
Bought by
Richardson Louise
Home Financials for this Owner
Home Financials are based on the most recent Mortgage that was taken out on this home.
Original Mortgage
$67,500
Interest Rate
9.75%
Mortgage Type
New Conventional
Create a Home Valuation Report for This Property
The Home Valuation Report is an in-depth analysis detailing your home's value as well as a comparison with similar homes in the area
Home Values in the Area
Average Home Value in this Area
Purchase History
| Date | Buyer | Sale Price | Title Company |
|---|---|---|---|
| Sullivan Lydia D | -- | -- | |
| Sullivan Mary | -- | -- | |
| Sullivan Francis C | $130,000 | -- | |
| Andrieni Fred | -- | -- | |
| S & A Holdings Inc | $46,000 | -- | |
| Richardson Louise | $75,000 | -- |
Source: Public Records
Mortgage History
| Date | Status | Borrower | Loan Amount |
|---|---|---|---|
| Previous Owner | Sullivan Francis C | $104,000 | |
| Previous Owner | Richardson Louise | $67,500 |
Source: Public Records
Tax History Compared to Growth
Tax History
| Year | Tax Paid | Tax Assessment Tax Assessment Total Assessment is a certain percentage of the fair market value that is determined by local assessors to be the total taxable value of land and additions on the property. | Land | Improvement |
|---|---|---|---|---|
| 2025 | $3,028 | $58,000 | $46,980 | $11,020 |
| 2024 | $3,980 | $80,280 | $46,800 | $33,480 |
| 2023 | $3,980 | $58,000 | $46,800 | $11,200 |
| 2022 | $2,577 | $52,000 | $35,760 | $16,240 |
| 2021 | $4,754 | $100,480 | $35,760 | $64,720 |
| 2020 | $3,716 | $77,960 | $22,520 | $55,440 |
| 2019 | $2,668 | $80,400 | $22,520 | $57,880 |
| 2018 | $2,441 | $54,000 | $19,980 | $34,020 |
| 2017 | $3,191 | $54,000 | $19,980 | $34,020 |
| 2016 | $2,580 | $60,360 | $22,520 | $37,840 |
| 2014 | $2,222 | $42,160 | $22,520 | $19,640 |
Source: Public Records
Map
Nearby Homes
- 1708 Cooledge Rd
- 1732 Cooledge Rd
- 1732 Cooledge Rd Unit A
- 1717 Ronald Rd
- 1709 Ronald Rd
- 1723 Ronald Rd
- 1704 Cooledge Rd
- 1703 Ronald Rd
- 1738 Cooledge Rd
- 1731 Ronald Rd
- 1719 Cooledge Rd
- 1715 Cooledge Rd
- 1723 Cooledge Rd
- 1705 Cooledge Rd
- 1733 Cooledge Rd
- 0 Cooledge Rd Unit 7290694
- 0 Cooledge Rd Unit 2979472
- 0 Cooledge Rd
- 1739 Ronald Rd
- 1690 Cooledge Rd