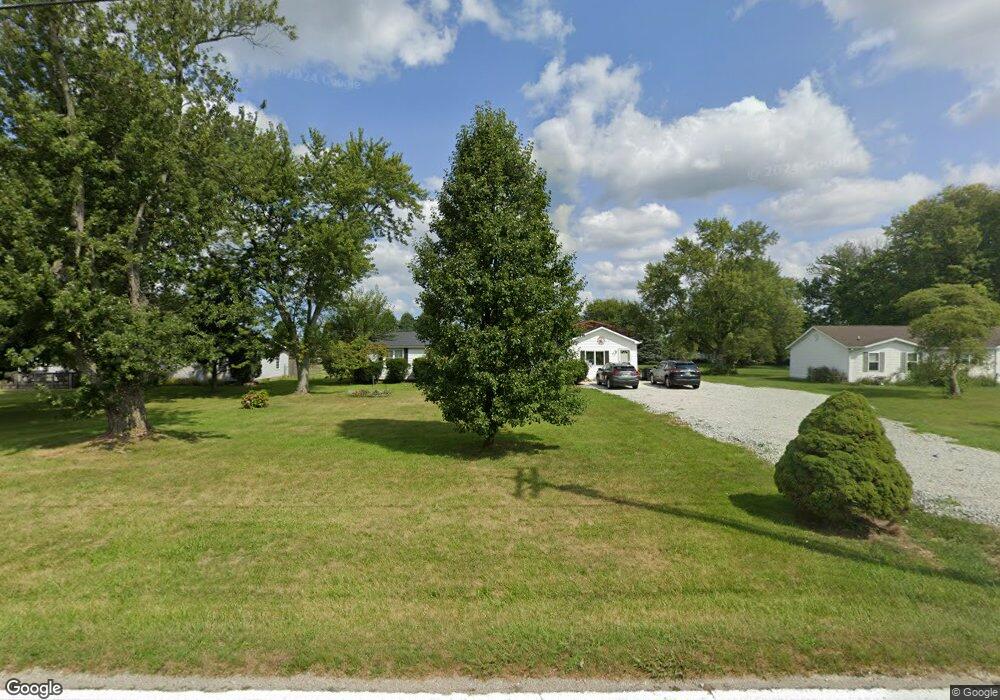
1714 E 400 N Greenfield, IN 46140
Estimated Value: $234,000 - $284,000
4
Beds
2
Baths
1,717
Sq Ft
$151/Sq Ft
Est. Value
About This Home
This home is located at 1714 E 400 N, Greenfield, IN 46140 and is currently estimated at $260,029, approximately $151 per square foot. 1714 E 400 N is a home located in Hancock County with nearby schools including Maxwell Intermediate School, Eden Elementary School, and Greenfield Central Junior High School.
Ownership History
Date
Name
Owned For
Owner Type
Purchase Details
Closed on
May 7, 2010
Sold by
Halo Remodeling Llc
Bought by
Rose Paul R and Rose Teresa L
Current Estimated Value
Home Financials for this Owner
Home Financials are based on the most recent Mortgage that was taken out on this home.
Original Mortgage
$100,644
Outstanding Balance
$68,506
Interest Rate
5.37%
Mortgage Type
FHA
Estimated Equity
$191,523
Purchase Details
Closed on
Mar 12, 2010
Sold by
Thompson Thomas W
Bought by
Halo Remodeling Llc
Home Financials for this Owner
Home Financials are based on the most recent Mortgage that was taken out on this home.
Original Mortgage
$100,644
Outstanding Balance
$68,506
Interest Rate
5.37%
Mortgage Type
FHA
Estimated Equity
$191,523
Purchase Details
Closed on
Dec 30, 2009
Sold by
The Bank Of New York Mellon
Bought by
Thompson Thomas W and Thompson Karla R
Purchase Details
Closed on
Jul 31, 2009
Sold by
Hafey Jami L
Bought by
The Bank Of New York Mellon and The Bank Of New York
Create a Home Valuation Report for This Property
The Home Valuation Report is an in-depth analysis detailing your home's value as well as a comparison with similar homes in the area
Home Values in the Area
Average Home Value in this Area
Purchase History
| Date | Buyer | Sale Price | Title Company |
|---|---|---|---|
| Rose Paul R | -- | -- | |
| Halo Remodeling Llc | -- | -- | |
| Thompson Thomas W | -- | -- | |
| The Bank Of New York Mellon | $29,000 | -- |
Source: Public Records
Mortgage History
| Date | Status | Borrower | Loan Amount |
|---|---|---|---|
| Open | Rose Paul R | $100,644 |
Source: Public Records
Tax History Compared to Growth
Tax History
| Year | Tax Paid | Tax Assessment Tax Assessment Total Assessment is a certain percentage of the fair market value that is determined by local assessors to be the total taxable value of land and additions on the property. | Land | Improvement |
|---|---|---|---|---|
| 2024 | $1,168 | $184,300 | $57,500 | $126,800 |
| 2023 | $1,168 | $176,400 | $57,500 | $118,900 |
| 2022 | $931 | $150,200 | $32,900 | $117,300 |
| 2021 | $655 | $120,800 | $32,900 | $87,900 |
| 2020 | $630 | $116,200 | $32,900 | $83,300 |
| 2019 | $582 | $111,500 | $32,900 | $78,600 |
| 2018 | $590 | $110,800 | $32,900 | $77,900 |
| 2017 | $625 | $109,600 | $32,900 | $76,700 |
| 2016 | $650 | $107,100 | $32,600 | $74,500 |
| 2014 | $632 | $107,600 | $31,600 | $76,000 |
| 2013 | $632 | $107,600 | $31,600 | $76,000 |
Source: Public Records
Map
Nearby Homes
- 3669 N Kelly Dr
- 3696 N State Road 9
- 3598 N State Road 9
- 7 Holmes Ct
- 3625 Cranberry Dr
- 4045 N 50 E
- 4786 N Mill Ct
- 4778 N Country Mill Dr
- 108 S Center St
- 2330 E Mill Stream Dr
- 3494 N 300 E
- 5695 N Red Oak Dr
- 651 Fern St
- 2420 E Hill Dr
- 5176 N 300 E
- 901 E 600 N
- 000 N 25 W
- 2487 E 600 N
- 00 Fields Blvd
- 534 E 600 N