B
Seller's Agent in 2025
Brad Baker
Coldwell Banker / Kennon, Parker, Duncan & Davis
(615) 830-4353
16 in this area
245 Total Sales
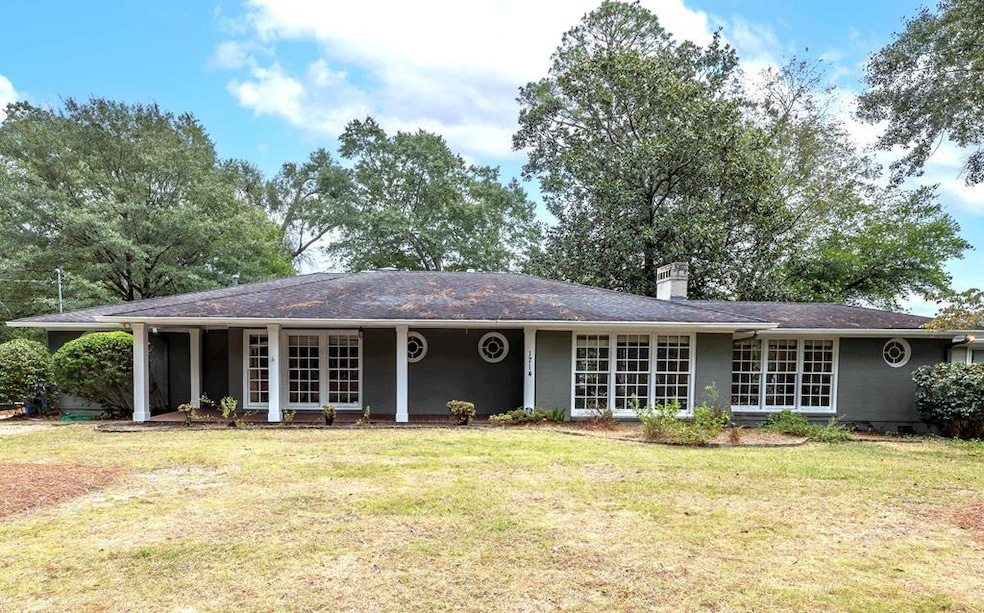
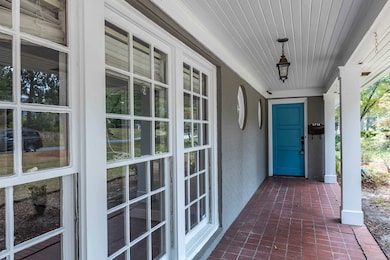
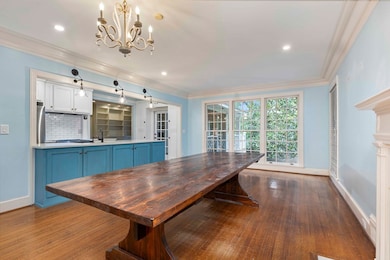
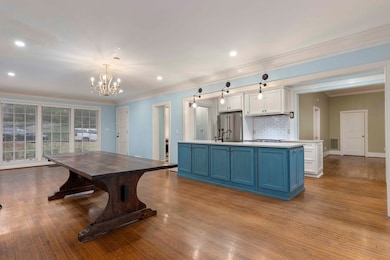
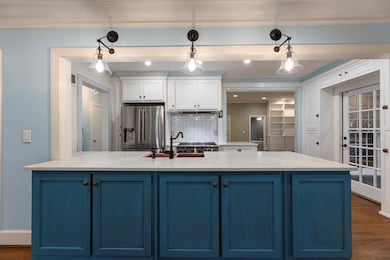
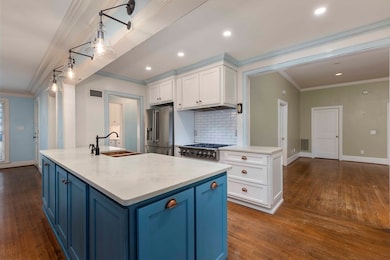

Now is your chance at $7500 any way you want it on closing costs, rate buy down, or upgrades with an acceptable offer! Come home to 1714 Iris Drive, a beautifully maintained and stylishly updated home in the heart of vibrant Midtown Columbus. This 3-bedroom, 3-bathroom residence blends timeless character with modern upgrades, offering the best of both worlds in one of the city's most desirable neighborhoods. Step inside to discover gorgeous original hardwood floors that add warmth and character throughout the main living spaces. The completely renovated kitchen is a showstopper—featuring sleek quartz countertops, copper sink, stainless-steel high-end appliances, and thoughtful design that will inspire your inner chef. Just off the kitchen, a unique butler's pantry offers an oven and additional counter space—perfect for entertaining or serious meal prep. Each of the three full bathrooms is stylishly appointed, and the spacious bedrooms provide comfort and flexibility for any lifestyle. You will love the custom built in cabinetry, high ceilings, fireplace and views of the back deck from the living room. Outside, enjoy the covered front and back porches, screened porch and fully fenced back yard along with the charm and convenience of Midtown living, just minutes from local dining, shopping, museums, and quick access to the highway for an easy commute anywhere in town. Don't miss your chance to own this perfect blend of location, charm, and modern living—schedule your showing today!
Last Agent to Sell the Property
Coldwell Banker / Kennon, Parker, Duncan & Davis Brokerage Phone: 7062561000 License #369482 Listed on: 10/03/2025

| Date | Type | Sale Price | Title Company |
|---|---|---|---|
| Special Warranty Deed | $365,000 | None Listed On Document | |
| Warranty Deed | $238,250 | -- | |
| Warranty Deed | $209,000 | -- | |
| Warranty Deed | $270,000 | None Available |
| Date | Status | Loan Amount | Loan Type |
|---|---|---|---|
| Open | $200,000 | New Conventional | |
| Previous Owner | $243,372 | VA | |
| Previous Owner | $213,493 | VA | |
| Previous Owner | $216,000 | Purchase Money Mortgage |
| Date | Event | Price | List to Sale | Price per Sq Ft |
|---|---|---|---|---|
| 11/14/2025 11/14/25 | Sold | $365,000 | -1.3% | $148 / Sq Ft |
| 10/21/2025 10/21/25 | Pending | -- | -- | -- |
| 10/03/2025 10/03/25 | For Sale | $369,900 | -- | $150 / Sq Ft |
| Year | Tax Paid | Tax Assessment Tax Assessment Total Assessment is a certain percentage of the fair market value that is determined by local assessors to be the total taxable value of land and additions on the property. | Land | Improvement |
|---|---|---|---|---|
| 2025 | -- | $115,088 | $18,464 | $96,624 |
| 2024 | -- | $115,088 | $18,464 | $96,624 |
| 2023 | $0 | $115,088 | $18,464 | $96,624 |
| 2022 | $0 | $89,080 | $18,464 | $70,616 |
| 2021 | $0 | $86,316 | $18,464 | $67,852 |
| 2020 | $0 | $86,316 | $18,464 | $67,852 |
| 2019 | $3,536 | $86,316 | $18,464 | $67,852 |
| 2018 | $3,425 | $83,600 | $17,880 | $65,720 |
| 2017 | $3,901 | $85,180 | $18,464 | $66,716 |
| 2016 | $3,916 | $108,210 | $12,023 | $96,187 |
| 2015 | $1,569 | $108,210 | $12,023 | $96,187 |
| 2014 | $1,571 | $108,210 | $12,023 | $96,187 |
| 2013 | -- | $108,210 | $12,023 | $96,187 |
B
Seller's Agent in 2025
Brad Baker
Coldwell Banker / Kennon, Parker, Duncan & Davis
(615) 830-4353
16 in this area
245 Total Sales
Buyer's Agent in 2025
Tracy Dean
Keller Williams Realty River Cities
(706) 332-2777
13 in this area
150 Total Sales
Source: Columbus Board of REALTORS® (GA)
MLS Number: 223745
APN: 067-031-011
Disclaimer: Certain information contained herein is derived from information provided by parties other than Homes.com. All information provided is deemed reliable, but is not guaranteed to be accurate and should be independently verified.
![]() IDX information is provided exclusively for personal, non-commercial use, and may not be used for any purpose other than to identify prospective properties consumers may be interested in purchasing. Information is deemed reliable but not guaranteed.
IDX information is provided exclusively for personal, non-commercial use, and may not be used for any purpose other than to identify prospective properties consumers may be interested in purchasing. Information is deemed reliable but not guaranteed.
Ask me questions while you tour the home.