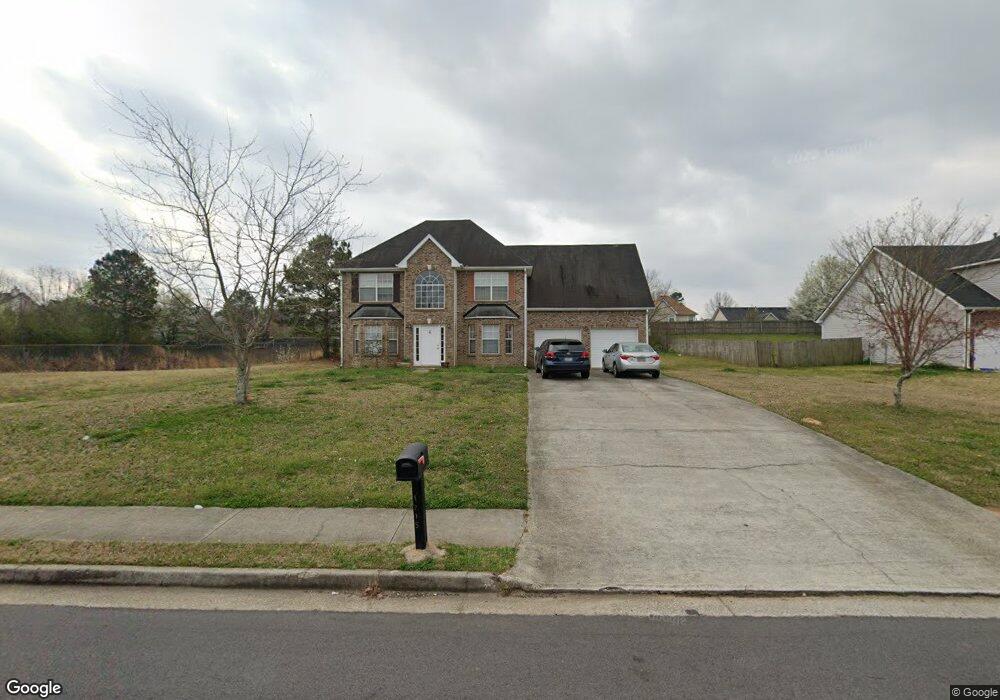
1715 Deer Crossing Way Jonesboro, GA 30236
Estimated Value: $315,203 - $370,000
3
Beds
3
Baths
2,691
Sq Ft
$126/Sq Ft
Est. Value
About This Home
This home is located at 1715 Deer Crossing Way, Jonesboro, GA 30236 and is currently estimated at $339,051, approximately $125 per square foot. 1715 Deer Crossing Way is a home located in Clayton County with nearby schools including Suder Elementary School, Mundys Mill Middle School, and Jonesboro High School.
Ownership History
Date
Name
Owned For
Owner Type
Purchase Details
Closed on
Sep 28, 2018
Sold by
Ouy Veronica
Bought by
Ouy Jenny L
Current Estimated Value
Purchase Details
Closed on
Sep 8, 2017
Sold by
Jenny Ouy
Bought by
Ouy Jenny L and Veronica Ouy
Purchase Details
Closed on
Sep 18, 2008
Sold by
Federal National Mortgage Association
Bought by
Ouy Jenny
Purchase Details
Closed on
Aug 7, 2007
Sold by
Everhome Mortgage
Bought by
Federal National Mortgage Association
Purchase Details
Closed on
Jul 9, 2003
Sold by
Legacy Communities Of Deer Crossing
Bought by
Sterling Mary L H and Sterling Teressa
Home Financials for this Owner
Home Financials are based on the most recent Mortgage that was taken out on this home.
Original Mortgage
$161,200
Interest Rate
5.2%
Mortgage Type
New Conventional
Create a Home Valuation Report for This Property
The Home Valuation Report is an in-depth analysis detailing your home's value as well as a comparison with similar homes in the area
Home Values in the Area
Average Home Value in this Area
Purchase History
| Date | Buyer | Sale Price | Title Company |
|---|---|---|---|
| Ouy Jenny L | -- | -- | |
| Ouy Jenny L | -- | -- | |
| Ouy Jenny | -- | -- | |
| Federal National Mortgage Association | -- | -- | |
| Everhome Mortgage Co | -- | -- | |
| Everhome Mtg Corp | $162,252 | -- | |
| Sterling Mary L H | $163,500 | -- |
Source: Public Records
Mortgage History
| Date | Status | Borrower | Loan Amount |
|---|---|---|---|
| Previous Owner | Sterling Mary L H | $161,200 |
Source: Public Records
Tax History Compared to Growth
Tax History
| Year | Tax Paid | Tax Assessment Tax Assessment Total Assessment is a certain percentage of the fair market value that is determined by local assessors to be the total taxable value of land and additions on the property. | Land | Improvement |
|---|---|---|---|---|
| 2024 | $4,641 | $122,920 | $9,600 | $113,320 |
| 2023 | $4,432 | $122,760 | $9,600 | $113,160 |
| 2022 | $3,757 | $94,760 | $9,600 | $85,160 |
| 2021 | $2,995 | $74,880 | $9,600 | $65,280 |
| 2020 | $2,970 | $73,302 | $9,600 | $63,702 |
| 2019 | $2,757 | $66,989 | $9,600 | $57,389 |
| 2018 | $2,124 | $61,380 | $9,600 | $51,780 |
| 2017 | $2,350 | $56,809 | $9,600 | $47,209 |
| 2016 | $2,243 | $54,186 | $9,600 | $44,586 |
| 2015 | $1,854 | $0 | $0 | $0 |
| 2014 | $1,544 | $37,857 | $9,600 | $28,257 |
Source: Public Records
Map
Nearby Homes
- 1770 Deer Crossing Cir
- 9492 Deer Crossing Trace
- 1814 Deer Crossing Way
- 9419 Rocky Creek
- 0 Turner Rd Unit 20172270
- 0 Turner Rd Unit 20172265
- 1935 Watercrest Dr
- 9510 Creekside Rd
- 1720 Byrom Pkwy Unit 2
- 9176 Chickasaw Ct
- 9243 Seminole Rd
- 9124 Ogala Ct
- 9132 Endicott Place
- 9444 Maple Grove Ln Unit 60
- 9457 Maple Grove Ln Unit LOT 262
- 9451 Maple Grove Ln Unit LOT 265
- 9441 Maple Grove Ln Unit LOT 267
- 9394 Maple Grove Ln Unit 37
- 9394 Maple Grove Ln
- 9434 Maple Grove Ln Unit 55
- 1707 Deer Crossing Way
- 0 Deer Crossing Way Unit 8696895
- 0 Deer Crossing Way Unit 8532303
- 0 Deer Crossing Way Unit 8439603
- 0 Deer Crossing Way Unit 8338739
- 0 Deer Crossing Way
- 1710 Deer Crossing Cir
- 1739 Deer Crossing Way
- 1699 Deer Crossing Way
- 9382 Deer Crossing Cove
- 1704 Deer Crossing Cir
- 1698 Deer Crossing Cir
- 9381 Deer Crossing Cove
- 1692 Deer Crossing Cir
- 1728 Deer Crossing Cir
- 1686 Deer Crossing Cir
- 1747 Deer Crossing Way
- 1691 Deer Crossing Way
- 1680 Deer Crossing Cir
- 1705 Deer Crossing Cir