1715 Jordan St Saginaw, MI 48602
Southwest NeighborhoodEstimated Value: $64,824 - $78,000
4
Beds
2
Baths
1,223
Sq Ft
$59/Sq Ft
Est. Value
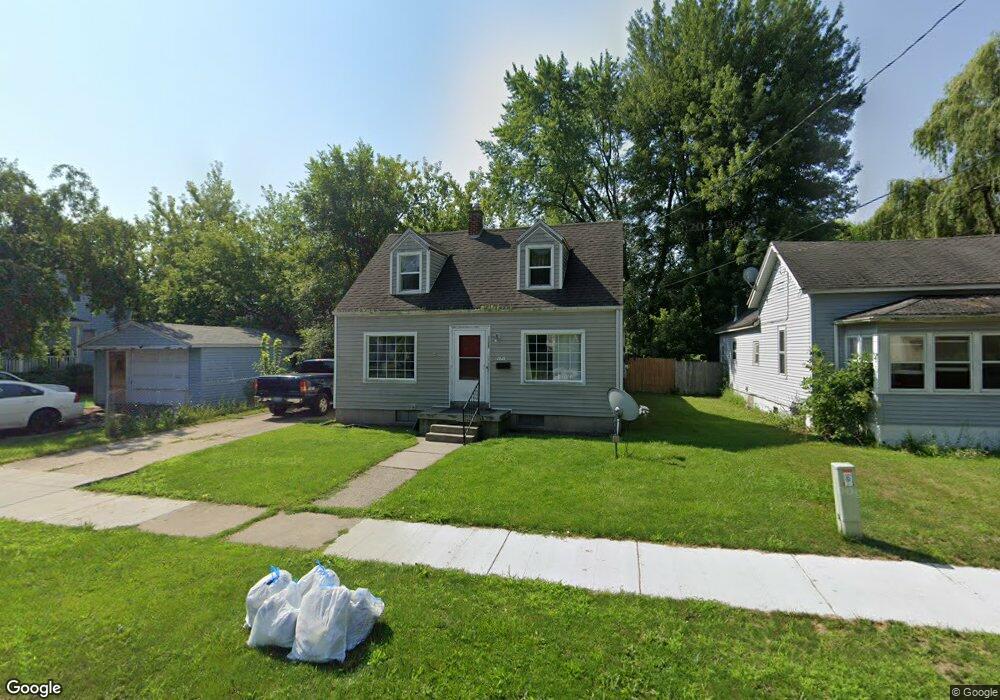
About This Home
This home is located at 1715 Jordan St, Saginaw, MI 48602 and is currently estimated at $72,706, approximately $59 per square foot. 1715 Jordan St is a home located in Saginaw County with nearby schools including Merrill Park Elementary School, Thompson Middle School, and Arthur Hill High School.
Ownership History
Date
Name
Owned For
Owner Type
Purchase Details
Closed on
Feb 15, 2008
Sold by
M E R S Inc
Bought by
Bank Of New York
Current Estimated Value
Purchase Details
Closed on
Feb 1, 2008
Sold by
Kerekes Kimberly
Bought by
M E R S Inc
Purchase Details
Closed on
Jan 26, 2008
Sold by
Bank Of New York
Bought by
Beagle Thomas
Purchase Details
Closed on
Jul 29, 2005
Sold by
Casavan Donald H
Bought by
Kerekes Kimberly
Purchase Details
Closed on
Mar 1, 2005
Sold by
Housing Urban Development
Bought by
Casavan Donald H
Purchase Details
Closed on
Nov 17, 2004
Sold by
Mortgage Electronic Registration
Bought by
Housing Urban Development
Purchase Details
Closed on
May 27, 2004
Sold by
Dilley Keith
Bought by
Mortgage Electronic Registration
Purchase Details
Closed on
Aug 30, 1993
Sold by
Bellinder, David & Sears Mtge Co
Bought by
Dilley Keith and Ruppel Karen
Purchase Details
Closed on
Sep 10, 1990
Sold by
Rubalcava Alfred and Rubalcava Betty J
Bought by
Bellinder David D
Create a Home Valuation Report for This Property
The Home Valuation Report is an in-depth analysis detailing your home's value as well as a comparison with similar homes in the area
Home Values in the Area
Average Home Value in this Area
Purchase History
| Date | Buyer | Sale Price | Title Company |
|---|---|---|---|
| Bank Of New York | -- | -- | |
| M E R S Inc | -- | -- | |
| Beagle Thomas | $19,000 | -- | |
| Kerekes Kimberly | $74,200 | -- | |
| Casavan Donald H | $24,900 | -- | |
| Casavan Donald H | $24,901 | Wolverton Title Research Co | |
| Housing Urban Development | -- | -- | |
| Hud | -- | Ata Title Agency | |
| Mortgage Electronic Registration | $42,800 | -- | |
| Mortgage Electronic Registration Systems | $42,846 | -- | |
| Dilley Keith | -- | -- | |
| Bellinder David D | $37,900 | -- |
Source: Public Records
Tax History Compared to Growth
Tax History
| Year | Tax Paid | Tax Assessment Tax Assessment Total Assessment is a certain percentage of the fair market value that is determined by local assessors to be the total taxable value of land and additions on the property. | Land | Improvement |
|---|---|---|---|---|
| 2025 | $1,576 | $28,900 | $0 | $0 |
| 2024 | $1,288 | $26,200 | $0 | $0 |
| 2023 | $1,237 | $23,200 | $0 | $0 |
| 2022 | $1,445 | $20,000 | $0 | $0 |
| 2021 | $1,360 | $18,600 | $0 | $0 |
| 2020 | $1,225 | $19,300 | $0 | $0 |
| 2019 | $1,230 | $17,900 | $900 | $17,000 |
| 2018 | $1,035 | $18,974 | $0 | $0 |
| 2017 | $1,408 | $18,350 | $0 | $0 |
| 2016 | $1,372 | $18,239 | $0 | $0 |
| 2014 | -- | $18,925 | $0 | $18,005 |
| 2013 | -- | $19,619 | $0 | $0 |
Source: Public Records
Map
Nearby Homes
- 1725 Kendrick St
- 1756 Jordan St
- 1830 Jordan St
- 1817 Ring St
- 1843 Kendrick St
- 1723 Maine St
- 1823 Ring St
- 1548 Maine St
- 1544 Maine St
- 2300 Jerome St
- 1620 Vermont St
- 2219 S Michigan Ave
- 1306 S Wheeler St
- 1703 Marquette St
- 1924 Wood St
- 1700 Marquette St
- 1802 Marquette St
- 1514 Marquette St
- 1916 Joslin St
- 1914 Joslin St