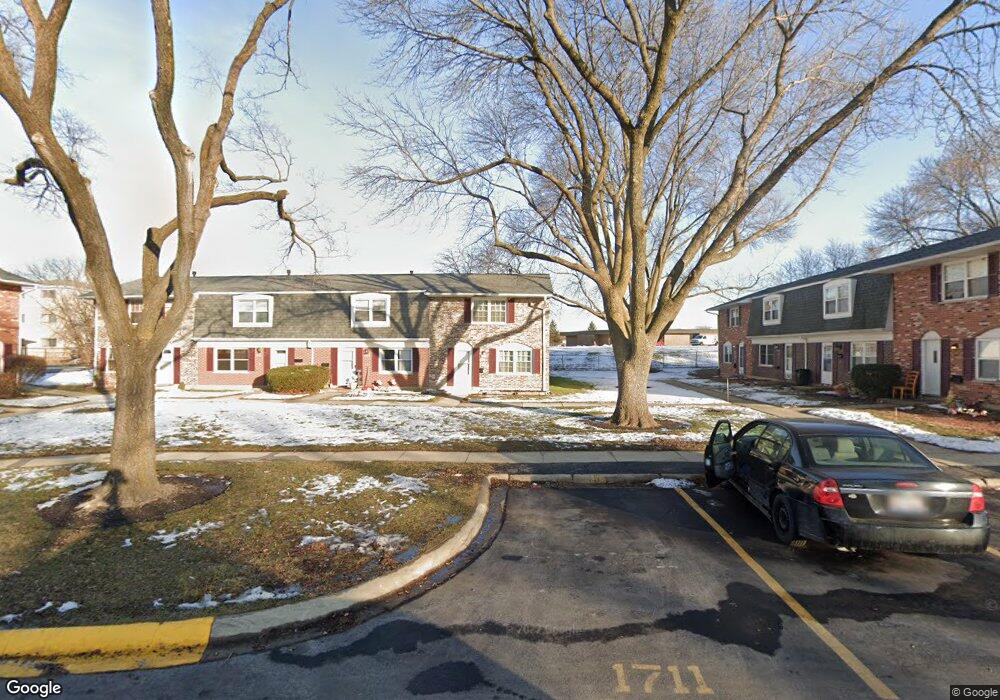
1715 Mckool Ave Streamwood, IL 60107
Woodland Heights NeighborhoodEstimated Value: $208,000 - $230,000
3
Beds
2
Baths
1,160
Sq Ft
$189/Sq Ft
Est. Value
About This Home
This home is located at 1715 Mckool Ave, Streamwood, IL 60107 and is currently estimated at $219,416, approximately $189 per square foot. 1715 Mckool Ave is a home located in Cook County with nearby schools including Parkwood Elementary School, Tefft Middle School, and Streamwood High School.
Ownership History
Date
Name
Owned For
Owner Type
Purchase Details
Closed on
Feb 10, 2007
Sold by
Rodea Arturo and Martinez Maria Cecilia
Bought by
Rodea Arturo
Current Estimated Value
Home Financials for this Owner
Home Financials are based on the most recent Mortgage that was taken out on this home.
Original Mortgage
$109,900
Interest Rate
6.4%
Mortgage Type
New Conventional
Purchase Details
Closed on
May 28, 2002
Sold by
Bojaca Nancy and Bojaca Beatriz
Bought by
Rodea Arturo and Rodea Gregorio
Home Financials for this Owner
Home Financials are based on the most recent Mortgage that was taken out on this home.
Original Mortgage
$108,785
Interest Rate
6.95%
Mortgage Type
FHA
Purchase Details
Closed on
Apr 24, 1996
Sold by
Cruz Jun M and Cruz Evangelina
Bought by
Bojaca Nancy and Bojaca Beatriz
Home Financials for this Owner
Home Financials are based on the most recent Mortgage that was taken out on this home.
Original Mortgage
$73,824
Interest Rate
7.91%
Mortgage Type
FHA
Create a Home Valuation Report for This Property
The Home Valuation Report is an in-depth analysis detailing your home's value as well as a comparison with similar homes in the area
Home Values in the Area
Average Home Value in this Area
Purchase History
| Date | Buyer | Sale Price | Title Company |
|---|---|---|---|
| Rodea Arturo | -- | None Available | |
| Rodea Arturo | $110,500 | Lawyers Title Ins Corp | |
| Bojaca Nancy | $74,000 | Attorneys Natl Title Network |
Source: Public Records
Mortgage History
| Date | Status | Borrower | Loan Amount |
|---|---|---|---|
| Closed | Rodea Arturo | $109,900 | |
| Closed | Rodea Arturo | $108,785 | |
| Previous Owner | Bojaca Nancy | $73,824 |
Source: Public Records
Tax History
| Year | Tax Paid | Tax Assessment Tax Assessment Total Assessment is a certain percentage of the fair market value that is determined by local assessors to be the total taxable value of land and additions on the property. | Land | Improvement |
|---|---|---|---|---|
| 2025 | $3,291 | $18,000 | $1,863 | $16,137 |
| 2024 | $3,291 | $14,000 | $1,500 | $12,500 |
| 2023 | $3,174 | $14,000 | $1,500 | $12,500 |
| 2022 | $3,174 | $14,000 | $1,500 | $12,500 |
| 2021 | $2,318 | $9,672 | $383 | $9,289 |
| 2020 | $2,361 | $9,672 | $383 | $9,289 |
| 2019 | $2,338 | $10,747 | $383 | $10,364 |
| 2018 | $3,039 | $12,063 | $328 | $11,735 |
| 2017 | $3,018 | $12,063 | $328 | $11,735 |
| 2016 | $3,098 | $12,063 | $328 | $11,735 |
| 2015 | $2,478 | $9,609 | $301 | $9,308 |
| 2014 | $2,459 | $9,609 | $301 | $9,308 |
| 2013 | $2,363 | $9,609 | $301 | $9,308 |
Source: Public Records
Map
Nearby Homes
- 1723 Mckool Ave
- 1837 Mckool Ave
- 805 Stowell Ave
- 727 Lacy Ave
- 1531 Mckool Ave
- 7290 Gladiola Ave Unit 3
- 6988 Plumtree Ln
- 128 Sycamore Ave
- 7151 Mulberry St
- 6967 Hemlock St
- 1861 Hollywood Ave
- 1917 Linden Ave
- 1830 Marigold Ln Unit 2
- 2110 Cherry Ave
- 6881 Hickory St
- 6835 Plumtree Ln
- 55 King Dr
- 1777 Linden Ave
- 1712 Poplar Ave
- 733 Oriole Dr
- 1713 Mckool Ave
- 1711 Mckool Ave Unit 6406
- 1709 Mckool Ave
- 1719 Mckool Ave
- 1717 Mckool Ave
- 1721 Mckool Ave
- 1721 Mckool Ave Unit 1721
- 1707 Mckool Ave Unit 13
- 1705 Mckool Ave
- 1705 Mckool Ave Unit NONE
- 1703 Mckool Ave
- 1725 Mckool Ave
- 1701 Mckool Ave Unit 6401
- 1727 Mckool Ave
- 1729 Mckool Ave
- 1729 Mckool Ave Unit 1729
- 1671 Mckool Ave
- 1669 Mckool Ave
- 1731 Mckool Ave
- 1667 Mckool Ave
Your Personal Tour Guide
Ask me questions while you tour the home.