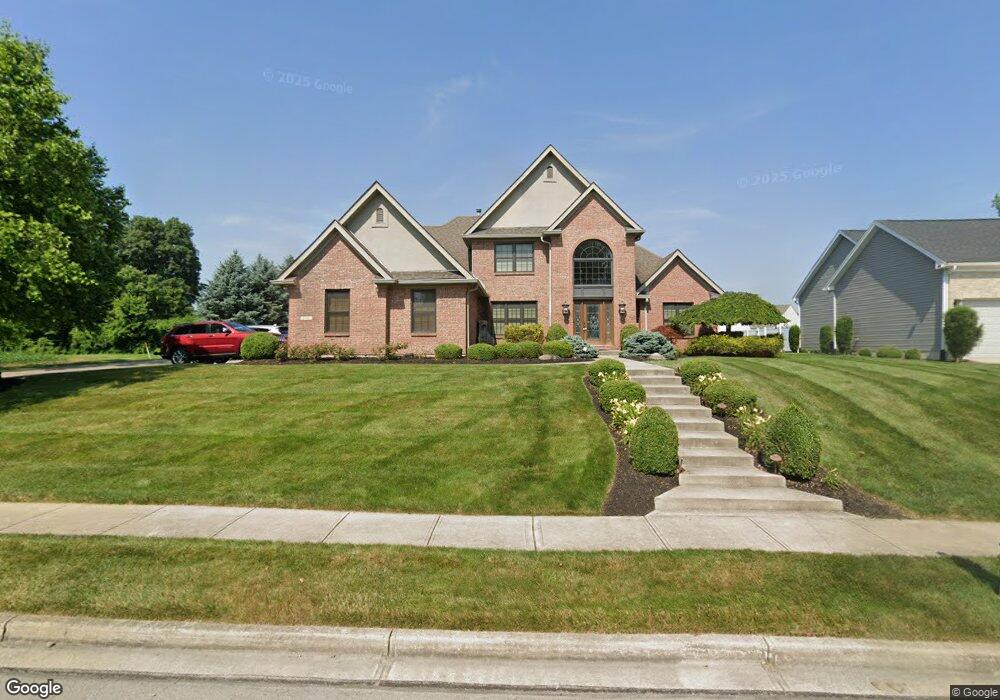
1715 Mulberry Woods Ct Vandalia, OH 45377
Estimated Value: $427,000 - $514,000
4
Beds
4
Baths
4,168
Sq Ft
$116/Sq Ft
Est. Value
About This Home
This home is located at 1715 Mulberry Woods Ct, Vandalia, OH 45377 and is currently estimated at $484,171, approximately $116 per square foot. 1715 Mulberry Woods Ct is a home located in Montgomery County with nearby schools including Helke Elementary School, Morton Middle School, and Butler High School.
Ownership History
Date
Name
Owned For
Owner Type
Purchase Details
Closed on
Mar 18, 2022
Sold by
Crossley Lawrence M
Bought by
Lawrence M Crossley Revocable Living Trust
Current Estimated Value
Purchase Details
Closed on
Aug 10, 2016
Sold by
Wendling Edward P and Wendling Karen L
Bought by
Crossley Lawrence M
Purchase Details
Closed on
Apr 22, 2011
Sold by
Crenshaw Irene and Crenshaw Irene C
Bought by
Wendling Edward F and Wendling Karen L
Home Financials for this Owner
Home Financials are based on the most recent Mortgage that was taken out on this home.
Original Mortgage
$156,000
Interest Rate
4.86%
Mortgage Type
Purchase Money Mortgage
Purchase Details
Closed on
Mar 7, 2007
Sold by
Crenshaw Larry
Bought by
Crenshaw Irene
Purchase Details
Closed on
Dec 8, 1997
Sold by
Gilbert Homes Inc
Bought by
Crenshaw Larry C and Crenshaw Irene C
Create a Home Valuation Report for This Property
The Home Valuation Report is an in-depth analysis detailing your home's value as well as a comparison with similar homes in the area
Home Values in the Area
Average Home Value in this Area
Purchase History
| Date | Buyer | Sale Price | Title Company |
|---|---|---|---|
| Lawrence M Crossley Revocable Living Trust | -- | None Listed On Document | |
| Crossley Lawrence M | $356,000 | First Ohio Title Insurance | |
| Wendling Edward F | $195,000 | Attorney | |
| Crenshaw Irene | -- | None Available | |
| Crenshaw Larry C | $265,000 | -- |
Source: Public Records
Mortgage History
| Date | Status | Borrower | Loan Amount |
|---|---|---|---|
| Previous Owner | Wendling Edward F | $156,000 |
Source: Public Records
Tax History Compared to Growth
Tax History
| Year | Tax Paid | Tax Assessment Tax Assessment Total Assessment is a certain percentage of the fair market value that is determined by local assessors to be the total taxable value of land and additions on the property. | Land | Improvement |
|---|---|---|---|---|
| 2024 | $7,360 | $141,480 | $17,640 | $123,840 |
| 2023 | $7,360 | $141,480 | $17,640 | $123,840 |
| 2022 | $7,211 | $112,120 | $14,000 | $98,120 |
| 2021 | $7,217 | $112,120 | $14,000 | $98,120 |
| 2020 | $7,196 | $112,120 | $14,000 | $98,120 |
| 2019 | $7,453 | $106,460 | $14,000 | $92,460 |
| 2018 | $7,467 | $106,460 | $14,000 | $92,460 |
| 2017 | $7,411 | $106,460 | $14,000 | $92,460 |
| 2016 | $6,310 | $89,030 | $14,000 | $75,030 |
| 2015 | $6,231 | $89,030 | $14,000 | $75,030 |
| 2014 | $6,231 | $89,030 | $14,000 | $75,030 |
| 2012 | -- | $71,760 | $17,500 | $54,260 |
Source: Public Records
Map
Nearby Homes
- 1515 Ash Ridge Ct
- 1441 S Dixie Dr
- 1588 Middle Park Dr
- 246 Crest Hill Ave
- 1052 Forest Crest Place
- 3518 Park Crest Ln
- 1054 Wilhelmina Dr
- 3600 Little York Rd
- 416 Bent Twig Dr
- 469 Farrell Rd
- 696 W Alkaline Springs Rd
- 917 Howard Ln
- 461 Poplar Grove Dr
- 1201 Greystone Cir
- 770 Deer Creek Dr
- Johnstown Plan at Yorkshire Reserve - The Oaks
- Newcastle Plan at Yorkshire Reserve - The Oaks
- Bellamy Plan at Yorkshire Reserve - The Oaks
- Milford Plan at Yorkshire Reserve - The Oaks
- Holcombe Plan at Yorkshire Reserve - The Oaks
- 1705 Mulberry Woods Ct
- 1720 Mulberry Woods Ct
- 1685 Mulberry Woods Ct
- 1710 Mulberry Woods Ct
- 1690 Mulberry Woods Ct
- 1665 Mulberry Woods Ct
- 1688 Ashworth Dr
- 1664 Ashworth Dr
- 1698 Ashworth Dr
- 1676 Ashworth Dr
- 1670 Mulberry Woods Ct
- 1652 Ashworth Dr
- 1645 Mulberry Woods Ct
- 3921 Mulberry Rd
- 1710 Ashworth Dr
- 1650 Mulberry Woods Ct
- 1640 Ashworth Dr
- 1695 Ashworth Dr
- 1673 Ashworth Dr
- 1651 Ashworth Dr