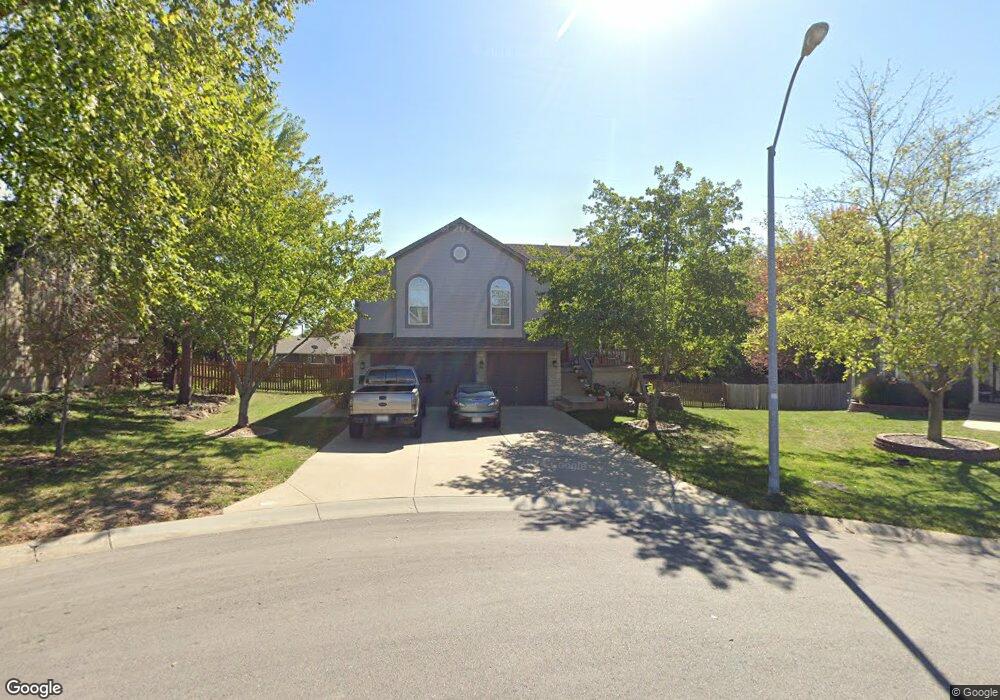
1715 Red Barn Rd Raymore, MO 64083
Estimated Value: $396,629 - $481,000
4
Beds
3
Baths
2,854
Sq Ft
$154/Sq Ft
Est. Value
About This Home
This home is located at 1715 Red Barn Rd, Raymore, MO 64083 and is currently estimated at $440,657, approximately $154 per square foot. 1715 Red Barn Rd is a home located in Cass County with nearby schools including Stonegate Elementary School, Raymore-Peculiar South Middle School, and Raymore-Peculiar Senior High School.
Ownership History
Date
Name
Owned For
Owner Type
Purchase Details
Closed on
Apr 7, 2015
Sold by
Folkers David D and Folkers Virginia A
Bought by
Chick Ii Michael Robert and Chick Suzann J
Current Estimated Value
Home Financials for this Owner
Home Financials are based on the most recent Mortgage that was taken out on this home.
Original Mortgage
$232,391
Outstanding Balance
$178,779
Interest Rate
3.88%
Mortgage Type
New Conventional
Estimated Equity
$261,878
Purchase Details
Closed on
May 23, 2014
Sold by
James Elizabeth Lee and James Kathleen Collier
Bought by
Folkers David D and Bross Folkers Virginia A
Home Financials for this Owner
Home Financials are based on the most recent Mortgage that was taken out on this home.
Original Mortgage
$821,000
Interest Rate
4.32%
Mortgage Type
Purchase Money Mortgage
Create a Home Valuation Report for This Property
The Home Valuation Report is an in-depth analysis detailing your home's value as well as a comparison with similar homes in the area
Home Values in the Area
Average Home Value in this Area
Purchase History
We collect this data history from publicly available records. To have your information removed, we recommend requesting removal directly through your county’s website.
| Date | Buyer | Sale Price | Title Company |
|---|---|---|---|
| Chick Ii Michael Robert | -- | Stewart Title Company | |
| Folkers David D | -- | Stewart Title Co |
Source: Public Records
Mortgage History
We collect this data history from publicly available records. To have your information removed, we recommend requesting removal directly through your county’s website.
| Date | Status | Borrower | Loan Amount |
|---|---|---|---|
| Open | Chick Ii Michael Robert | $232,391 | |
| Previous Owner | Folkers David D | $821,000 |
Source: Public Records
Tax History
| Year | Tax Paid | Tax Assessment Tax Assessment Total Assessment is a certain percentage of the fair market value that is determined by local assessors to be the total taxable value of land and additions on the property. | Land | Improvement |
|---|---|---|---|---|
| 2025 | $4,039 | $56,120 | $8,110 | $48,010 |
| 2024 | $4,039 | $49,630 | $7,370 | $42,260 |
| 2023 | $4,034 | $49,630 | $7,370 | $42,260 |
| 2022 | $3,540 | $43,270 | $7,370 | $35,900 |
| 2021 | $3,541 | $43,270 | $7,370 | $35,900 |
| 2020 | $3,475 | $41,720 | $7,370 | $34,350 |
| 2019 | $3,355 | $41,720 | $7,370 | $34,350 |
| 2018 | $3,100 | $37,230 | $6,150 | $31,080 |
| 2017 | $2,788 | $37,230 | $6,150 | $31,080 |
| 2016 | $2,788 | $34,750 | $6,150 | $28,600 |
| 2015 | $2,790 | $34,750 | $6,150 | $28,600 |
| 2014 | $2,791 | $34,750 | $6,150 | $28,600 |
| 2013 | -- | $34,750 | $6,150 | $28,600 |
Source: Public Records
Map
Nearby Homes
- 1817 Prairie Grass Dr
- 1717 Longhorn Ln
- 710 Gamma Grass Place
- 1519 Bridlewood Ln
- 2010 Prairie Grass Dr
- 1506 Horseshoe Dr
- 830 Cedar Ridge Dr
- 2007 Sequoia Dr
- 1401 Rylee Ct
- 1408 Cedar Ridge Cir
- 523 Brookwood Ln
- 503 River Birch Rd
- 414 Eagle Glen Dr
- 408 Woodview Dr
- 1102 Bristol Dr
- 1016 Carlisle Dr
- 1016 Bristol Dr
- 308 Woodview Dr
- 1309 Larkspur Place
- 1408 Larkspur Place
- 1716 Red Barn Rd
- 1716 Overbrook Ln
- 1713 Red Barn Rd
- 2114 Red Barn Rd
- 1714 Overbrook Ln
- 1718 Overbrook Ln
- 1711 Red Barn Rd
- 1714 Red Barn Rd
- 1712 Overbrook Ln
- 1710 Red Barn Rd
- 1712 Red Barn Rd
- 1708 Red Barn Rd
- 1709 Red Barn Rd
- 1719 Overbrook Ln
- 1710 Overbrook Ln
- 1706 Red Barn Rd
- 1707 Red Barn Rd
- 725 Moss Creek Dr
- 1715 Overbrook Ln
- 1708 Overbrook Ln
Your Personal Tour Guide
Ask me questions while you tour the home.