Estimated Value: $304,000 - $363,000
2
Beds
1
Bath
1,232
Sq Ft
$268/Sq Ft
Est. Value
About This Home
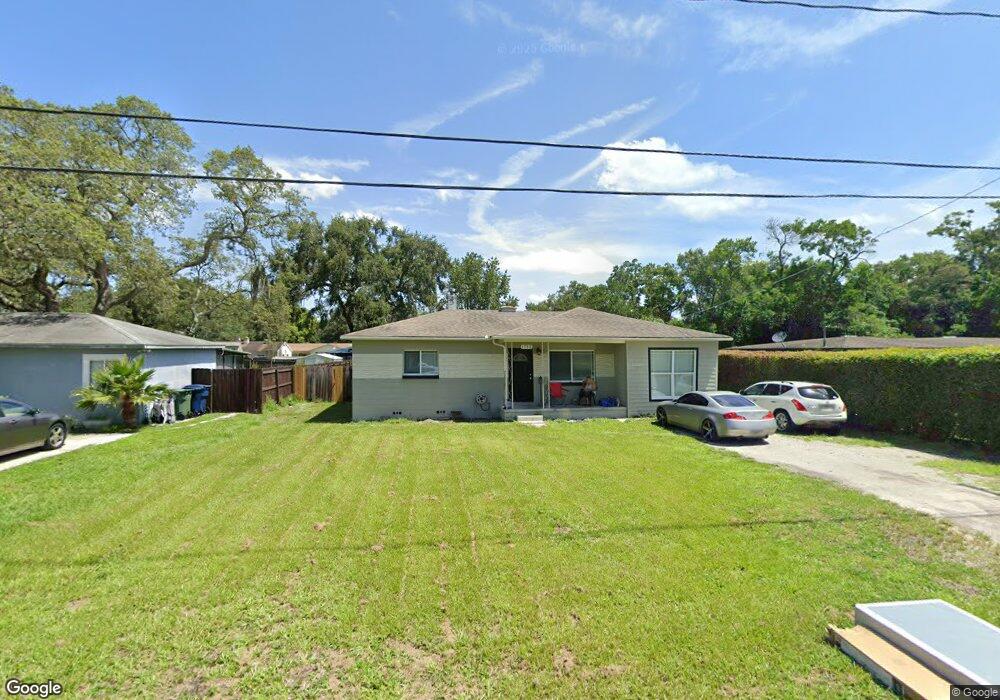
This home is located at 1715 W Fore Dr Unit 2, Tampa, FL 33612 and is currently estimated at $329,611, approximately $267 per square foot. 1715 W Fore Dr Unit 2 is a home located in Hillsborough County with nearby schools including Lake Magdalene Elementary School, Adams Middle School, and Chamberlain High School.
Ownership History
Date
Name
Owned For
Owner Type
Purchase Details
Closed on
May 20, 2011
Sold by
Cusmano Emily
Bought by
Cusmano Joseph and Cusmano Theresa
Current Estimated Value
Purchase Details
Closed on
Apr 15, 2011
Sold by
Skaff Philip G and Skaff Karen
Bought by
Federal National Mortgage Association
Purchase Details
Closed on
May 1, 2006
Sold by
Cardoso Joe and Cardoso Tina Marie
Bought by
Skaff Philip G and Skaff Karen
Home Financials for this Owner
Home Financials are based on the most recent Mortgage that was taken out on this home.
Original Mortgage
$112,500
Interest Rate
6.31%
Mortgage Type
Fannie Mae Freddie Mac
Purchase Details
Closed on
Mar 5, 2004
Sold by
Johnston Glenn E
Bought by
Cardoso Joe and Marie Tina
Home Financials for this Owner
Home Financials are based on the most recent Mortgage that was taken out on this home.
Original Mortgage
$89,600
Interest Rate
9.35%
Mortgage Type
Unknown
Create a Home Valuation Report for This Property
The Home Valuation Report is an in-depth analysis detailing your home's value as well as a comparison with similar homes in the area
Home Values in the Area
Average Home Value in this Area
Purchase History
| Date | Buyer | Sale Price | Title Company |
|---|---|---|---|
| Cusmano Joseph | $19,200 | None Available | |
| Cusmano Emily | $45,000 | Title & Abstract Agency Of A | |
| Federal National Mortgage Association | -- | None Available | |
| Skaff Philip G | $125,000 | Lacoast Title | |
| Cardoso Joe | $112,000 | All Real Estate Title Svcs I |
Source: Public Records
Mortgage History
| Date | Status | Borrower | Loan Amount |
|---|---|---|---|
| Previous Owner | Skaff Philip G | $112,500 | |
| Previous Owner | Cardoso Joe | $89,600 |
Source: Public Records
Tax History Compared to Growth
Tax History
| Year | Tax Paid | Tax Assessment Tax Assessment Total Assessment is a certain percentage of the fair market value that is determined by local assessors to be the total taxable value of land and additions on the property. | Land | Improvement |
|---|---|---|---|---|
| 2024 | $3,337 | $193,414 | $77,350 | $116,064 |
| 2023 | $3,138 | $189,183 | $68,250 | $120,933 |
| 2022 | $2,961 | $186,589 | $63,700 | $122,889 |
| 2021 | $2,583 | $138,154 | $45,500 | $92,654 |
| 2020 | $2,397 | $129,977 | $37,765 | $92,212 |
| 2019 | $2,204 | $118,582 | $28,665 | $89,917 |
| 2018 | $2,092 | $116,069 | $0 | $0 |
| 2017 | $1,878 | $102,474 | $0 | $0 |
| 2016 | $1,689 | $72,936 | $0 | $0 |
| 2015 | $1,517 | $66,305 | $0 | $0 |
| 2014 | $1,283 | $60,277 | $0 | $0 |
| 2013 | -- | $56,865 | $0 | $0 |
Source: Public Records
Map
Nearby Homes
- 1711 W Followthru Dr
- 1706 W Fore Dr
- 1719 W Overpar Dr
- 11331 N Oakleaf Ave
- 11505 N Rome Ave
- 10702 N Oregon Ave
- 2321 Carroll Grove Dr
- 10908 W Elbow Dr
- 1213 Cuttingin Place
- 10306 Fore Dr
- 10310 Carroll Cove Place
- 10915 N Newport Ave
- 12008 N Oregon Ave
- 1422 W Bogie Dr
- 1420 W Bogie Dr
- 10924 North Blvd
- 1414 W Bogie Dr
- 10406 Cliff Cir
- 1402 W Bogie Dr
- 1420 W Meadowbrook Ave
- 1717 W Fore Dr
- 1713 W Fore Dr Unit 2
- 1714 W Overpar Dr
- 1712 W Overpar Dr
- 1711 W Fore Dr
- 1719 W Fore Dr
- 1710 W Overpar Dr
- 1714 W Fore Dr
- 1716 W Fore Dr
- 1708 W Overpar Dr
- 1712 W Fore Dr
- 1718 W Overpar Dr
- 1718 W Fore Dr
- 1723 W Fore Dr
- 1707 W Fore Dr
- 1710 W Fore Dr
- 1720 W Fore Dr
- 1720 W Overpar Dr
- 1706 W Overpar Dr
- 1708 W Fore Dr