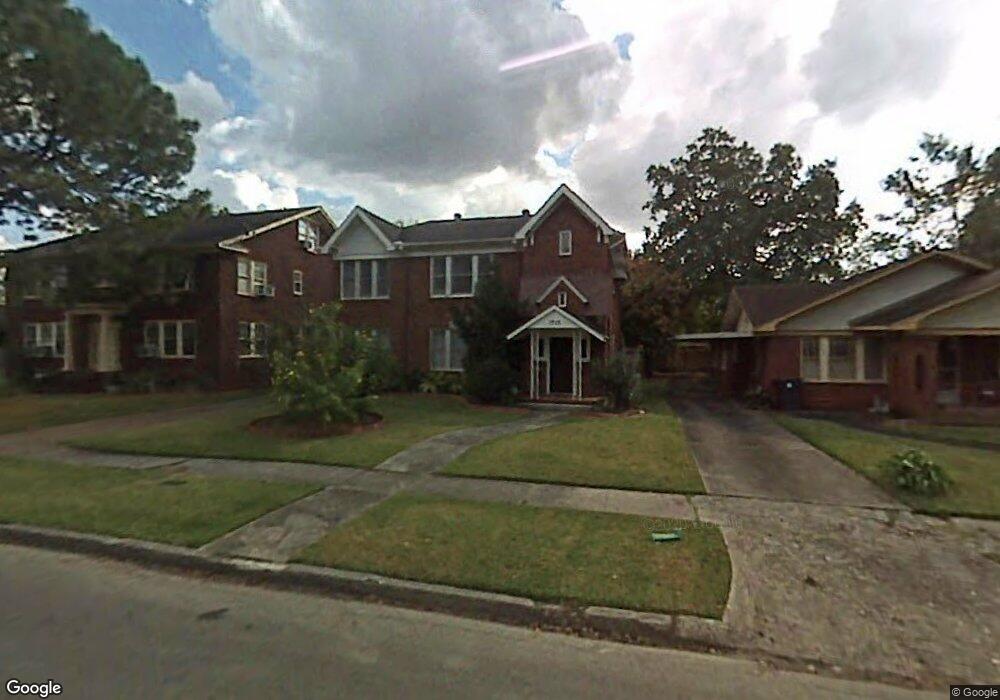
1715 W Main St Unit 2 Houston, TX 77098
Montrose NeighborhoodEstimated Value: $926,000 - $1,612,000
2
Beds
1
Bath
1,612
Sq Ft
$824/Sq Ft
Est. Value
About This Home
This home is located at 1715 W Main St Unit 2, Houston, TX 77098 and is currently estimated at $1,328,836, approximately $824 per square foot. 1715 W Main St Unit 2 is a home located in Harris County with nearby schools including Poe Elementary School, Lanier Middle School, and Lamar High School.
Ownership History
Date
Name
Owned For
Owner Type
Purchase Details
Closed on
Oct 7, 2013
Sold by
Hubbard Robert H and Hubbard Robert Howard
Bought by
Holland Julian Nathaniel
Current Estimated Value
Home Financials for this Owner
Home Financials are based on the most recent Mortgage that was taken out on this home.
Original Mortgage
$250,000
Outstanding Balance
$188,147
Interest Rate
4.54%
Mortgage Type
Purchase Money Mortgage
Estimated Equity
$1,140,689
Purchase Details
Closed on
Apr 9, 2007
Sold by
Hubbard Gloria C
Bought by
Hubbard Robert Howard
Purchase Details
Closed on
Apr 10, 2006
Sold by
Weidenkopf Violet Virginia Lee
Bought by
Hubbard Robert H
Home Financials for this Owner
Home Financials are based on the most recent Mortgage that was taken out on this home.
Original Mortgage
$262,575
Interest Rate
6.22%
Mortgage Type
Fannie Mae Freddie Mac
Create a Home Valuation Report for This Property
The Home Valuation Report is an in-depth analysis detailing your home's value as well as a comparison with similar homes in the area
Home Values in the Area
Average Home Value in this Area
Purchase History
| Date | Buyer | Sale Price | Title Company |
|---|---|---|---|
| Holland Julian Nathaniel | -- | None Available | |
| Hubbard Robert Howard | -- | None Available | |
| Hubbard Robert H | -- | First American Title |
Source: Public Records
Mortgage History
| Date | Status | Borrower | Loan Amount |
|---|---|---|---|
| Open | Holland Julian Nathaniel | $250,000 | |
| Previous Owner | Hubbard Robert H | $262,575 | |
| Closed | Hubbard Robert Howard | $0 |
Source: Public Records
Tax History Compared to Growth
Tax History
| Year | Tax Paid | Tax Assessment Tax Assessment Total Assessment is a certain percentage of the fair market value that is determined by local assessors to be the total taxable value of land and additions on the property. | Land | Improvement |
|---|---|---|---|---|
| 2025 | $17,626 | $1,202,300 | $750,000 | $452,300 |
| 2024 | $17,626 | $1,102,996 | $687,500 | $415,496 |
| 2023 | $17,626 | $1,163,584 | $687,500 | $476,084 |
| 2022 | $22,667 | $1,215,098 | $500,000 | $715,098 |
| 2021 | $21,811 | $935,838 | $500,000 | $435,838 |
| 2020 | $24,655 | $1,024,097 | $500,000 | $524,097 |
| 2019 | $23,422 | $925,589 | $500,000 | $425,589 |
| 2018 | $16,925 | $846,759 | $468,750 | $378,009 |
| 2017 | $22,469 | $846,759 | $468,750 | $378,009 |
| 2016 | $22,635 | $853,000 | $406,250 | $446,750 |
| 2015 | $10,493 | $837,000 | $375,000 | $462,000 |
| 2014 | $10,493 | $516,277 | $312,500 | $203,777 |
Source: Public Records
Map
Nearby Homes
- 1737 Branard St
- 1648 Colquitt St
- 1721 Colquitt St
- 1648 Richmond Ave
- 1615 W Main St
- 1805 Sul Ross St
- 1620, 1624 & 1630 Richmond Ave
- 1818 Colquitt St
- 1819 Branard St
- 1723 Marshall St
- 1638 W Alabama St
- 1802 Portsmouth St
- 1656 Norfolk St
- 1612 W Alabama St Unit ABCD
- 1844 Colquitt St
- 1826 Portsmouth St
- 1634 Marshall St
- 1849 W Main St Unit 15
- 1614 Norfolk St Unit C
- 1755 Kipling St
- 1715 W Main St
- 1719 W Main St
- 1711 W Main St
- 1711 W Main St Unit 1
- 1711 W Main St Unit 3
- 1711 W Main W Main St Unit 1
- 1711 W Main St Unit 4
- 1714 Colquitt St
- 1723 W Main St
- 1707 W Main St
- 1707 W Main St
- 1716 Colquitt St
- 1712 Colquitt St
- 1720 Colquitt St
- 1720 Colquitt St Unit 5
- 1725 W Main St
- 1725 W Main St Unit 816
- 1725 W Main St Unit 707
- 1725 W Main St Unit 2004S
- 1725 W Main St Unit 2004S