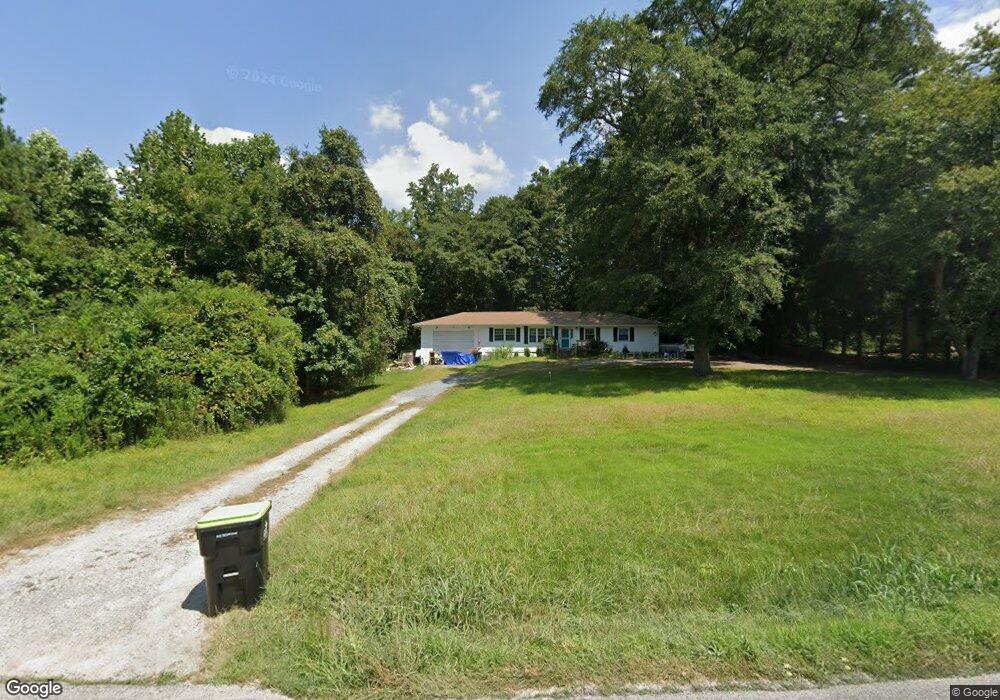
17155 Scotts Factory Rd Smithfield, VA 23430
Northern Isle of Wight NeighborhoodEstimated Value: $323,000 - $415,000
3
Beds
2
Baths
1,248
Sq Ft
$279/Sq Ft
Est. Value
About This Home
This home is located at 17155 Scotts Factory Rd, Smithfield, VA 23430 and is currently estimated at $348,729, approximately $279 per square foot. 17155 Scotts Factory Rd is a home located in Isle of Wight County with nearby schools including Windsor Elementary School, Smithfield Middle School, and Smithfield High School.
Ownership History
Date
Name
Owned For
Owner Type
Purchase Details
Closed on
Apr 23, 2024
Sold by
Hensley Jamie R
Bought by
Renick Lonny and Renick Tamara
Current Estimated Value
Home Financials for this Owner
Home Financials are based on the most recent Mortgage that was taken out on this home.
Original Mortgage
$270,300
Outstanding Balance
$266,153
Interest Rate
6.74%
Mortgage Type
New Conventional
Estimated Equity
$82,576
Purchase Details
Closed on
Jun 6, 2022
Sold by
Nelson Philip N
Bought by
Hensley Jamie R and Hensley Lee F
Home Financials for this Owner
Home Financials are based on the most recent Mortgage that was taken out on this home.
Original Mortgage
$284,000
Interest Rate
5.1%
Mortgage Type
VA
Purchase Details
Closed on
Apr 17, 2012
Sold by
Boyce Robert Chad
Purchase Details
Closed on
Jan 5, 2001
Create a Home Valuation Report for This Property
The Home Valuation Report is an in-depth analysis detailing your home's value as well as a comparison with similar homes in the area
Home Values in the Area
Average Home Value in this Area
Purchase History
| Date | Buyer | Sale Price | Title Company |
|---|---|---|---|
| Renick Lonny | $318,000 | Amrock Inc | |
| Hensley Jamie R | $284,000 | Archer L Jones Ii Pc | |
| -- | -- | -- | |
| -- | $70,000 | -- |
Source: Public Records
Mortgage History
| Date | Status | Borrower | Loan Amount |
|---|---|---|---|
| Open | Renick Lonny | $270,300 | |
| Previous Owner | Hensley Jamie R | $284,000 |
Source: Public Records
Tax History Compared to Growth
Tax History
| Year | Tax Paid | Tax Assessment Tax Assessment Total Assessment is a certain percentage of the fair market value that is determined by local assessors to be the total taxable value of land and additions on the property. | Land | Improvement |
|---|---|---|---|---|
| 2024 | $1,863 | $255,200 | $40,000 | $215,200 |
| 2023 | $1,866 | $255,200 | $40,000 | $215,200 |
| 2022 | $1,367 | $154,500 | $40,000 | $114,500 |
| 2021 | $1,367 | $154,500 | $40,000 | $114,500 |
| 2020 | $1,367 | $154,500 | $40,000 | $114,500 |
| 2019 | $1,367 | $154,500 | $40,000 | $114,500 |
| 2018 | $1,279 | $144,100 | $40,000 | $104,100 |
| 2016 | $1,297 | $144,100 | $40,000 | $104,100 |
| 2015 | $1,288 | $144,100 | $40,000 | $104,100 |
| 2014 | $1,288 | $143,100 | $45,000 | $98,100 |
| 2013 | -- | $143,100 | $45,000 | $98,100 |
Source: Public Records
Map
Nearby Homes
- 17858 Bowling Green Rd
- 16168 Smithfield Heights Dr
- 16209 Smithfield Heights Dr
- 15522 Carroll Bridge Rd
- 112 Gleneagles
- 16132 W Byron Dr
- 116 Royal Aberdeen
- 221 Royal Birkdale
- 225 Royal Birkdale
- 200 Oak Hill Ln
- 201 Oak Hill Ln
- 306 Oak Hill Ln
- 137 Boxwood Ln
- 200 Saint Andrews
- 17134 Longview Dr
- 201 Royal Dornoch
- 347 Spring Hill Place
- 407 Royal Dornoch
- 101 Ryder
- 203 Turnberry Rd
- 17173 Scotts Factory Rd
- 17162 Scotts Factory Rd
- 15687 Christopher Dr
- 15659 Christopher Dr
- 17182 Scotts Factory Rd
- 17205 Scotts Factory Rd
- 14220 Christopher Dr
- 17221 Scotts Factory Rd
- 17206 Scotts Factory Rd
- 15693 Christopher Dr
- 15693 Christopher Dr
- 17231 Scotts Factory Rd
- 17247 Scotts Factory Rd
- 17251 Scotts Factory Rd
- 17277 Scotts Factory Rd
- 17298 Scotts Factory Rd
- 17305 Scotts Factory Rd
- 17284 Scotts Factory Rd
- 15140 Hummingbird Ln
- 98 Robin Ln