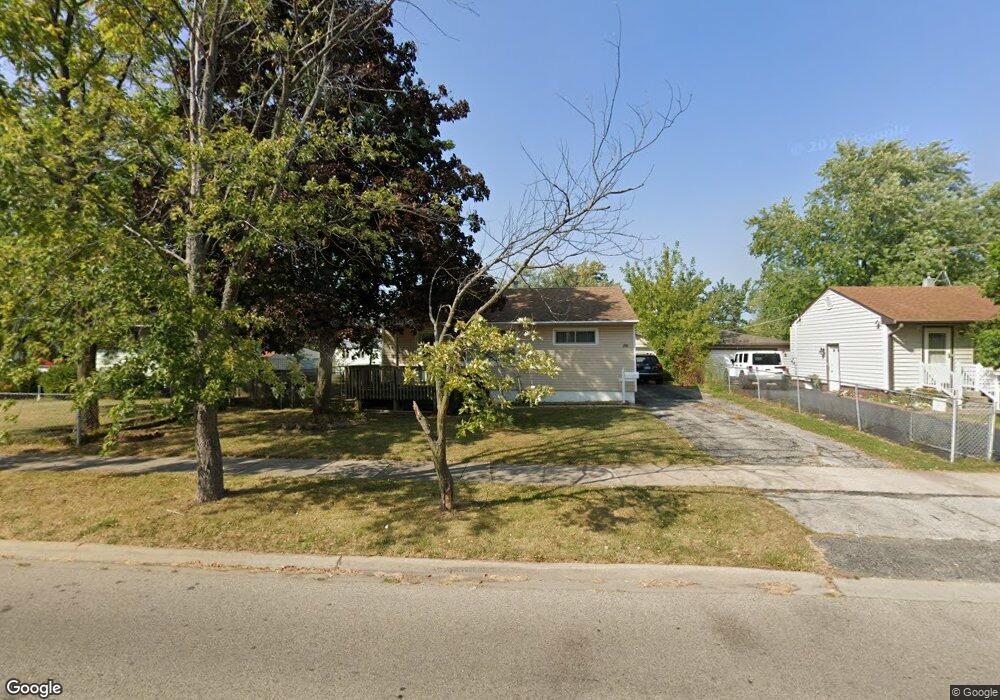
1716 Ballentine St Unit 4 Waukegan, IL 60087
Lake County Gardens NeighborhoodEstimated Value: $205,000 - $291,000
2
Beds
2
Baths
1,520
Sq Ft
$173/Sq Ft
Est. Value
About This Home
This home is located at 1716 Ballentine St Unit 4, Waukegan, IL 60087 and is currently estimated at $262,928, approximately $172 per square foot. 1716 Ballentine St Unit 4 is a home located in Lake County with nearby schools including Little Fort Elementary School, Jack Benny Middle School, and Waukegan High School.
Ownership History
Date
Name
Owned For
Owner Type
Purchase Details
Closed on
Apr 18, 2011
Sold by
Federal Home Loan Mortgage Corporation
Bought by
Vela Hector Ubaldo and Ronces Maria De La Luz
Current Estimated Value
Purchase Details
Closed on
Sep 9, 2010
Sold by
Rea
Bought by
Federal Home Loan Mortgage Corp
Purchase Details
Closed on
Aug 28, 2003
Sold by
Crews Cread G and Crews Betty A
Bought by
Rea Artemio A and Garcia Erica D
Home Financials for this Owner
Home Financials are based on the most recent Mortgage that was taken out on this home.
Original Mortgage
$111,550
Interest Rate
6.43%
Mortgage Type
Purchase Money Mortgage
Create a Home Valuation Report for This Property
The Home Valuation Report is an in-depth analysis detailing your home's value as well as a comparison with similar homes in the area
Home Values in the Area
Average Home Value in this Area
Purchase History
| Date | Buyer | Sale Price | Title Company |
|---|---|---|---|
| Vela Hector Ubaldo | $40,500 | First American Title | |
| Federal Home Loan Mortgage Corp | -- | None Available | |
| Rea Artemio A | $115,000 | -- |
Source: Public Records
Mortgage History
| Date | Status | Borrower | Loan Amount |
|---|---|---|---|
| Previous Owner | Rea Artemio A | $111,550 |
Source: Public Records
Tax History Compared to Growth
Tax History
| Year | Tax Paid | Tax Assessment Tax Assessment Total Assessment is a certain percentage of the fair market value that is determined by local assessors to be the total taxable value of land and additions on the property. | Land | Improvement |
|---|---|---|---|---|
| 2024 | $6,671 | $87,167 | $8,267 | $78,900 |
| 2023 | $5,585 | $78,746 | $7,469 | $71,277 |
| 2022 | $5,585 | $63,128 | $7,116 | $56,012 |
| 2021 | $5,131 | $55,211 | $6,161 | $49,050 |
| 2020 | $5,150 | $51,436 | $5,740 | $45,696 |
| 2019 | $5,131 | $47,133 | $5,260 | $41,873 |
| 2018 | $3,596 | $33,093 | $6,700 | $26,393 |
| 2017 | $3,311 | $29,278 | $5,928 | $23,350 |
| 2016 | $3,004 | $25,441 | $5,151 | $20,290 |
| 2015 | $2,833 | $22,770 | $4,610 | $18,160 |
| 2014 | $1,537 | $10,287 | $5,060 | $5,227 |
| 2012 | $784 | $11,144 | $5,481 | $5,663 |
Source: Public Records
Map
Nearby Homes
- 2613 N Lewis Ave
- 1612 Whitney St
- 1636 Rice St
- 2350 N Lewis Ave
- 3211 Rugby Ct
- 2232 Walnut St
- 2708 Dana Ave
- 2705 Dana Ave
- 37966 N Cornell Rd
- 3101 Country Club Ln
- 2713 Varonen Ave
- 12312 W Audrey Ave
- 3411 N Lewis Ave
- 37905 N Loyola Ave
- 301 W Eagle Ct
- 1913 Chippewa Rd
- 1905 Linden Ave
- 0 Traditions Dr
- 38127 N Shore Ave
- 2440 W Cheyenne Rd
- 1708 Ballentine St
- 1724 Ballentine St
- 1715 Boardman St
- 1709 Boardman St
- 1725 Boardman St
- 1700 Ballentine St
- 1730 Ballentine St
- 1701 Boardman St
- 1715 Ballentine St
- 1733 Boardman St
- 1725 Ballentine St
- 1709 Ballentine St
- 1648 Ballentine St
- 1733 Ballentine St
- 1738 Ballentine St
- 1649 Boardman St
- 2705 N Elmwood Ave Unit 4
- 1701 Ballentine St
- 1741 Ballentine St
- 1741 Boardman St Unit 4