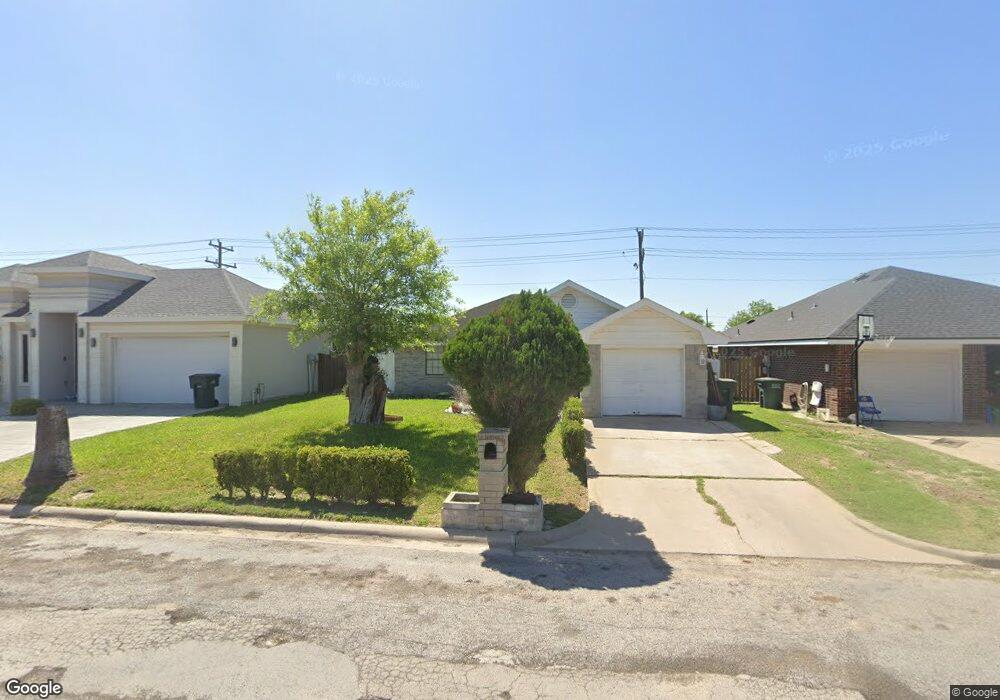
1716 Chula Vista Dr San Juan, TX 78589
Estimated Value: $164,322 - $186,000
3
Beds
2
Baths
1,403
Sq Ft
$124/Sq Ft
Est. Value
About This Home
This home is located at 1716 Chula Vista Dr, San Juan, TX 78589 and is currently estimated at $173,331, approximately $123 per square foot. 1716 Chula Vista Dr is a home located in Hidalgo County with nearby schools including Amanda Garza-Pena Elementary, Raul H. Yzaguirre Middle School, and PSJA Early College High School.
Ownership History
Date
Name
Owned For
Owner Type
Purchase Details
Closed on
Aug 26, 2019
Sold by
Gsf Land Group Ltd
Bought by
Sandoval David and Martinez Mayra Pruneda
Current Estimated Value
Home Financials for this Owner
Home Financials are based on the most recent Mortgage that was taken out on this home.
Original Mortgage
$29,500
Outstanding Balance
$25,945
Interest Rate
3.8%
Mortgage Type
Purchase Money Mortgage
Estimated Equity
$147,386
Purchase Details
Closed on
Nov 26, 2014
Sold by
Escovedo Jorge
Bought by
Pruneda Ruben
Home Financials for this Owner
Home Financials are based on the most recent Mortgage that was taken out on this home.
Original Mortgage
$59,000
Interest Rate
3.99%
Mortgage Type
Purchase Money Mortgage
Purchase Details
Closed on
Feb 17, 1998
Sold by
Cantu Carlos A and Cantu Ercilia F
Bought by
Rodriguez Felix and Rodriguez Mirella
Create a Home Valuation Report for This Property
The Home Valuation Report is an in-depth analysis detailing your home's value as well as a comparison with similar homes in the area
Home Values in the Area
Average Home Value in this Area
Purchase History
| Date | Buyer | Sale Price | Title Company |
|---|---|---|---|
| Sandoval David | -- | None Available | |
| Pruneda Ruben | -- | None Available | |
| Rodriguez Felix | -- | -- |
Source: Public Records
Mortgage History
| Date | Status | Borrower | Loan Amount |
|---|---|---|---|
| Open | Sandoval David | $29,500 | |
| Previous Owner | Pruneda Ruben | $59,000 |
Source: Public Records
Tax History Compared to Growth
Tax History
| Year | Tax Paid | Tax Assessment Tax Assessment Total Assessment is a certain percentage of the fair market value that is determined by local assessors to be the total taxable value of land and additions on the property. | Land | Improvement |
|---|---|---|---|---|
| 2025 | $3,421 | $124,409 | $35,750 | $88,659 |
| 2024 | $3,421 | $132,034 | $35,750 | $96,284 |
| 2023 | $3,497 | $135,058 | $30,750 | $104,308 |
| 2022 | $3,390 | $122,647 | $30,000 | $92,647 |
| 2021 | $2,981 | $105,481 | $30,000 | $75,481 |
| 2020 | $2,488 | $86,572 | $25,000 | $61,572 |
| 2019 | $2,007 | $67,315 | $18,750 | $48,565 |
| 2018 | $1,896 | $63,242 | $18,750 | $44,492 |
| 2017 | $1,954 | $64,750 | $18,750 | $46,000 |
| 2016 | $1,737 | $57,574 | $12,500 | $45,074 |
| 2015 | $1,573 | $59,004 | $12,500 | $46,504 |
Source: Public Records
Map
Nearby Homes
- 407 Guayavitos Ln
- 423 Cozumel Ln
- 1600 Pullin Ave
- 418 Chula Vista Dr
- 400 Veracruz Dr
- 306 E Pino St
- 308 E Pino St
- 310 E Pino St
- 312 E Pino St
- 1922 Cancun Dr
- 116 Sylvia Cir
- 305 E Salazar St
- 309 E Salazar St
- 115 Calle Del Jardin
- 1712 Sylvia Cir
- 406 Guadalupe Dr
- 700 E Fm 495
- 1318 Coconut Palm Ave
- 311 E Salazar St
- 132 E Ciro Dr
- 1714 Chula Vista Dr
- 1800 Chula Vista Dr
- 1802 Chula Vista Dr
- 1712 Chula Vista Dr
- 401 Cancun Ln
- 1710 Chula Vista Dr
- 1806 Chula Vista Dr
- 1806 Chula Vista Dr Unit 308
- 400 Cozumel Ln
- 403 Cancun Ln
- 1808 Chula Vista Dr
- 1708 Chula Vista Dr
- 402 Cozumel Ln
- 400 Cancun Ln
- 405 Cancun Ln
- 1706 Chula Vista Dr
- 404 Cozumel Ln
- 1810 Chula Vista Dr
- 402 Cancun Ln
- 401 Cozumel Ln