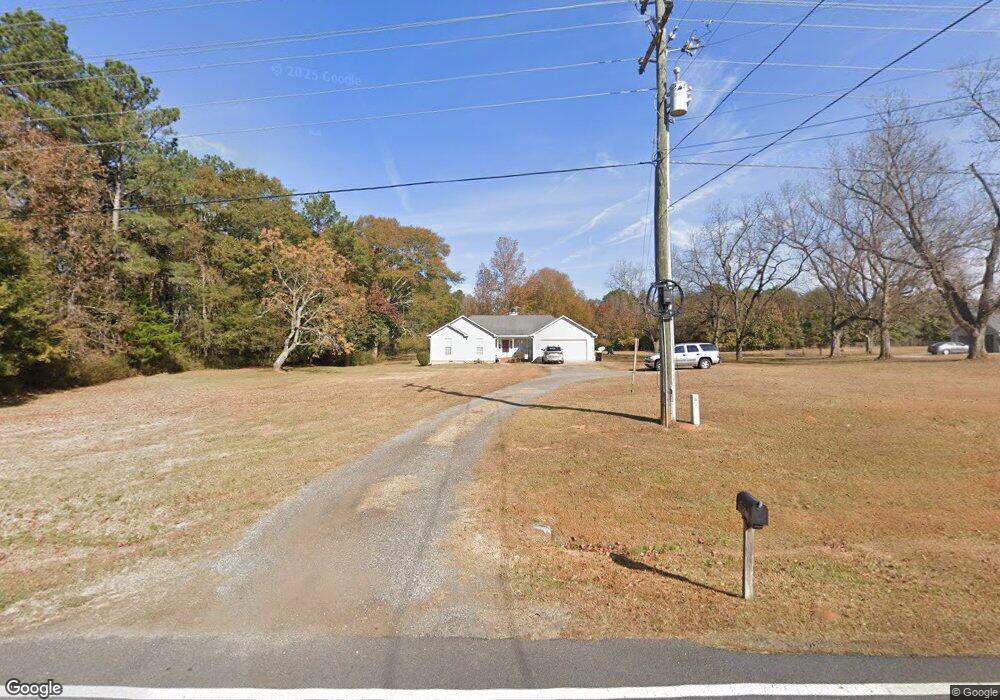
1716 Drew Allen Rd Williamson, GA 30292
Estimated Value: $265,767 - $288,000
3
Beds
2
Baths
1,286
Sq Ft
$215/Sq Ft
Est. Value
About This Home
This home is located at 1716 Drew Allen Rd, Williamson, GA 30292 and is currently estimated at $276,442, approximately $214 per square foot. 1716 Drew Allen Rd is a home located in Pike County with nearby schools including Pike County Primary School, Pike County Elementary School, and Pike County Middle School.
Ownership History
Date
Name
Owned For
Owner Type
Purchase Details
Closed on
Oct 30, 2009
Sold by
Gwyn Tricia P
Bought by
Bailey Rachel
Current Estimated Value
Home Financials for this Owner
Home Financials are based on the most recent Mortgage that was taken out on this home.
Original Mortgage
$100,000
Outstanding Balance
$65,062
Interest Rate
4.93%
Mortgage Type
New Conventional
Estimated Equity
$211,380
Purchase Details
Closed on
Feb 3, 2009
Sold by
Everhome Mtg Co
Bought by
Federal National Mtg Associati
Purchase Details
Closed on
Mar 23, 1999
Sold by
Mckenzie Ricky D
Bought by
Collins Donald B
Purchase Details
Closed on
Mar 26, 1998
Sold by
Mckenzie Dawn W
Bought by
Mckenzie Ricky D
Purchase Details
Closed on
Aug 31, 1994
Sold by
Smith R Douglas
Bought by
Mckenzie Ricky D and Mckenzie Dawn W
Create a Home Valuation Report for This Property
The Home Valuation Report is an in-depth analysis detailing your home's value as well as a comparison with similar homes in the area
Home Values in the Area
Average Home Value in this Area
Purchase History
| Date | Buyer | Sale Price | Title Company |
|---|---|---|---|
| Bailey Rachel | $98,000 | -- | |
| Bailey Rachel | $98,000 | -- | |
| Federal National Mtg Associati | $110,163 | -- | |
| Everhome Mtg Co | $110,163 | -- | |
| Federal National Mtg Associati | $110,163 | -- | |
| Collins Donald B | $92,000 | -- | |
| Mckenzie Ricky D | -- | -- | |
| Mckenzie Ricky D | $78,500 | -- |
Source: Public Records
Mortgage History
| Date | Status | Borrower | Loan Amount |
|---|---|---|---|
| Open | Bailey Rachel | $100,000 | |
| Closed | Everhome Mtg Co | $100,000 |
Source: Public Records
Tax History Compared to Growth
Tax History
| Year | Tax Paid | Tax Assessment Tax Assessment Total Assessment is a certain percentage of the fair market value that is determined by local assessors to be the total taxable value of land and additions on the property. | Land | Improvement |
|---|---|---|---|---|
| 2024 | $1,658 | $66,870 | $13,702 | $53,168 |
| 2023 | $1,940 | $66,870 | $13,702 | $53,168 |
| 2022 | $1,465 | $50,476 | $13,702 | $36,774 |
| 2021 | $1,516 | $50,476 | $13,702 | $36,774 |
| 2020 | $1,533 | $50,476 | $13,702 | $36,774 |
| 2019 | $1,265 | $36,632 | $8,120 | $28,512 |
| 2018 | $1,266 | $36,632 | $8,120 | $28,512 |
| 2017 | $1,255 | $36,632 | $8,120 | $28,512 |
| 2016 | $1,165 | $36,632 | $8,120 | $28,512 |
| 2015 | $1,110 | $36,632 | $8,120 | $28,512 |
| 2014 | $1,125 | $36,632 | $8,120 | $28,512 |
| 2013 | -- | $36,632 | $8,120 | $28,512 |
Source: Public Records
Map
Nearby Homes
- 291 Millie Tr
- 46 Millie Tr
- 2505 Plan at Ashley Glen
- 2604 Plan at Ashley Glen
- 2316 Plan at Ashley Glen
- 1902 Plan at Ashley Glen
- 2100 Plan at Ashley Glen
- 15316 Concord St
- 95 Joshua Ct
- 264 Brown Station Dr
- 16 Nelson Way Unit 38
- 92 Commanche Cir
- 0 US Highway 19 Unit 10432667
- 708 Traveler Ln
- 708 Traveler Ln Unit LOT 54
- 171 Jackson St
- 971 Traveler Ln Unit 43
- 1003 Traveler Ln Unit 44
- 851 Traveler Ln Unit 39
- 861 Traveler Ln Unit 40
- 1624 Drew Allen Rd
- 93 Twin Oaks Place
- 101 Twin Oaks Place
- 1604 Drew Allen Rd
- 1604 Drew Allen Rd Unit 19
- 1723 Drew Allen Rd
- 1637 Drew Allen Rd
- 75 Twin Oaks Place
- 1815 Drew Allen Rd Unit A
- 1815 Drew Allen Rd
- 1319 Twin Oaks Rd
- 102 Twin Oaks Place
- 56 Twin Oaks Place
- 1529 Drew Allen Rd
- 1196 Twin Oaks Rd
- 94 Twin Oaks Place
- 2066 Drew Allen Rd
- 0 Drew Allen Rd Unit 2950479
- 0 Drew Allen Rd Unit 3286595
- 0 Drew Allen Rd Unit 7039980