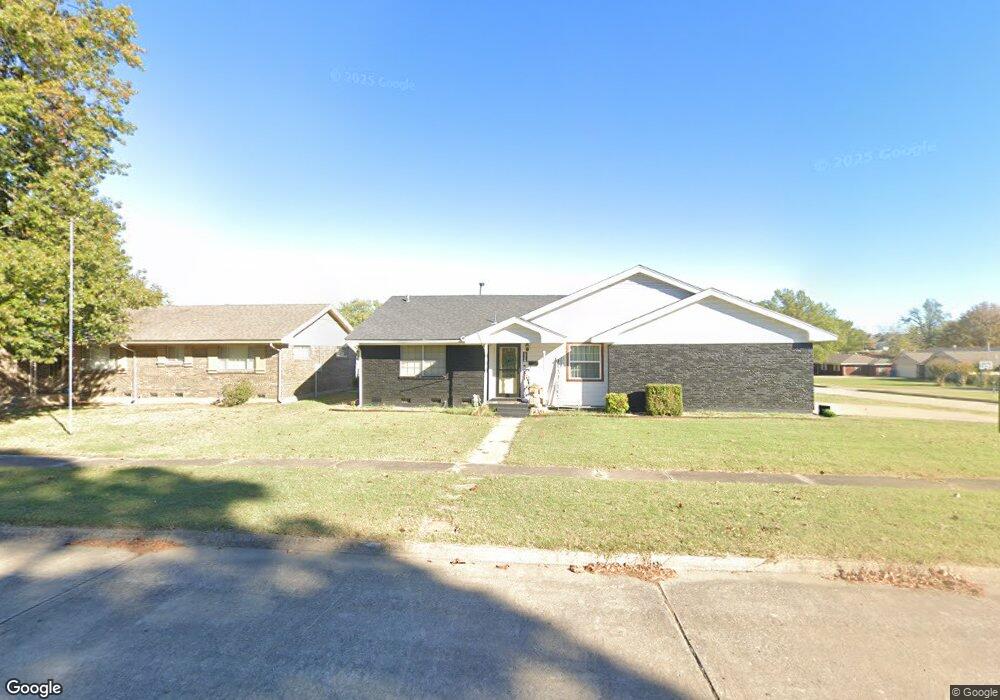
1716 Louise Dr McAlester, OK 74501
Estimated Value: $168,051 - $197,000
3
Beds
2
Baths
1,561
Sq Ft
$119/Sq Ft
Est. Value
About This Home
This home is located at 1716 Louise Dr, McAlester, OK 74501 and is currently estimated at $186,513, approximately $119 per square foot. 1716 Louise Dr is a home located in Pittsburg County with nearby schools including McAlester High School, Mcalester Christian Academy, and Lakewood Christian School.
Ownership History
Date
Name
Owned For
Owner Type
Purchase Details
Closed on
Dec 6, 2019
Sold by
Case Vickie S and Case Larry
Bought by
Williams Brooklyn
Current Estimated Value
Home Financials for this Owner
Home Financials are based on the most recent Mortgage that was taken out on this home.
Original Mortgage
$103,385
Outstanding Balance
$80,382
Interest Rate
3.75%
Mortgage Type
Commercial
Estimated Equity
$106,131
Purchase Details
Closed on
Mar 3, 2006
Sold by
Grimes Paul M and Grimes Donna K
Bought by
Smith James Weldon and Smith Shirley
Purchase Details
Closed on
Mar 2, 2006
Sold by
Cantrell Palph B and Cantrell Tommy Lee
Bought by
Smith James Weldon and Smith Shirley Jane
Purchase Details
Closed on
Jan 29, 2002
Sold by
Green Stephen
Bought by
Grimes Paul
Create a Home Valuation Report for This Property
The Home Valuation Report is an in-depth analysis detailing your home's value as well as a comparison with similar homes in the area
Home Values in the Area
Average Home Value in this Area
Purchase History
| Date | Buyer | Sale Price | Title Company |
|---|---|---|---|
| Williams Brooklyn | $115,000 | First American Title Ins Co | |
| Smith James Weldon | $80,000 | None Available | |
| Smith James Weldon | -- | None Available | |
| Grimes Paul | $70,000 | -- |
Source: Public Records
Mortgage History
| Date | Status | Borrower | Loan Amount |
|---|---|---|---|
| Open | Williams Brooklyn | $103,385 |
Source: Public Records
Tax History Compared to Growth
Tax History
| Year | Tax Paid | Tax Assessment Tax Assessment Total Assessment is a certain percentage of the fair market value that is determined by local assessors to be the total taxable value of land and additions on the property. | Land | Improvement |
|---|---|---|---|---|
| 2025 | $1,164 | $13,848 | $1,806 | $12,042 |
| 2024 | $1,164 | $13,282 | $1,806 | $11,476 |
| 2023 | $1,104 | $12,650 | $1,806 | $10,844 |
| 2022 | $1,108 | $12,650 | $1,806 | $10,844 |
| 2021 | $1,101 | $12,650 | $1,806 | $10,844 |
| 2020 | $1,109 | $12,650 | $1,806 | $10,844 |
| 2019 | $391 | $11,722 | $1,806 | $9,916 |
| 2018 | $373 | $4,621 | $712 | $3,909 |
| 2017 | $318 | $4,400 | $545 | $3,855 |
| 2016 | $633 | $8,801 | $1,091 | $7,710 |
| 2015 | $580 | $8,801 | $1,091 | $7,710 |
| 2014 | $580 | $8,801 | $1,091 | $7,710 |
Source: Public Records
Map
Nearby Homes
- 1709 Virginia Dr
- 1710 Louise Dr
- 1705 Virginia Dr
- 0 Oklahoma Ave
- 609 Garden Ln
- 1803 S 9th St
- 806 Lampton Ln
- 1800 Mockingbird Ln
- 701 Lampton Ln
- 509 Dove Dr
- 506 Garden Ln
- 1600 S 9th St
- 1800 Cardinal Ln
- 500 Garden Ln
- 1813 Mockingbird Ln
- 1521 S 9th St
- 622 Indiana Ave
- 33 River Oaks
- 0 Ono Ct
- 1910 Cardinal Ln
- 1714 Louise Dr
- 801 Oklahoma Ave
- 1713 Virginia Dr
- 1711 Virginia Dr
- 1715 Louise Dr
- 800 Oklahoma Ave
- 1713 Louise Dr
- 802 Oklahoma Ave
- 606 Garden Ln
- 804 Oklahoma Ave
- 607 Oklahoma Ave
- 1716 Virginia Dr
- 606 Oklahoma Ave
- 604 Garden Ln
- 1708 Louise Dr
- 1712 Virginia Dr
- 806 Oklahoma Ave
- 1710 Virginia Dr
- 605 Oklahoma Ave
- 1708 Virginia Dr