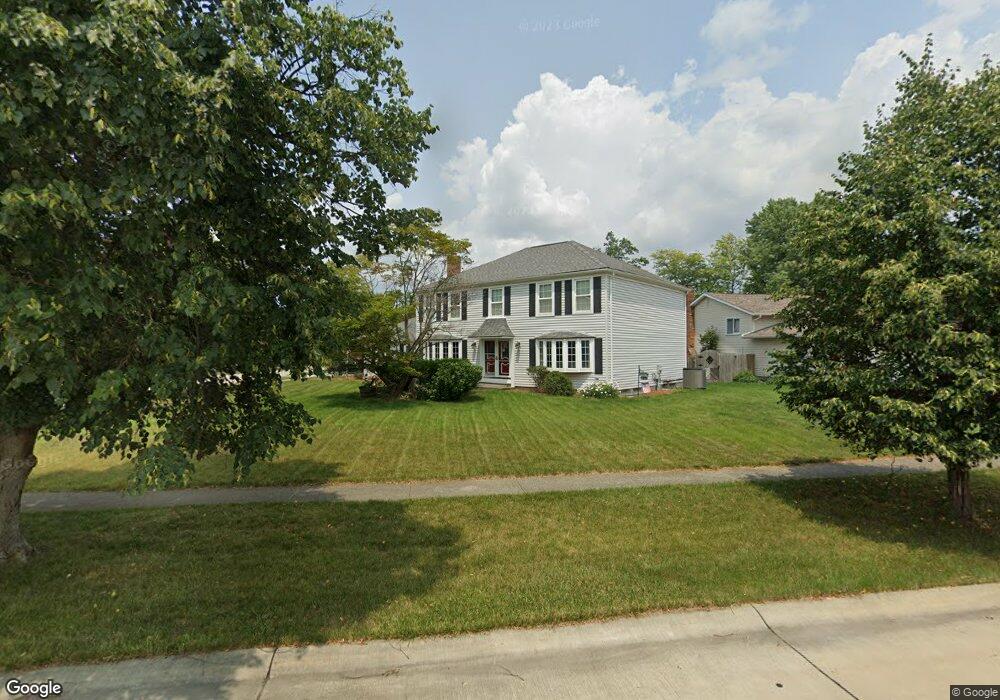
17165 Rabbit Run Dr Strongsville, OH 44136
Estimated Value: $366,000 - $405,000
4
Beds
3
Baths
2,438
Sq Ft
$159/Sq Ft
Est. Value
About This Home
This home is located at 17165 Rabbit Run Dr, Strongsville, OH 44136 and is currently estimated at $386,660, approximately $158 per square foot. 17165 Rabbit Run Dr is a home located in Cuyahoga County with nearby schools including Strongsville High School and Sts Joseph & John Interparochial School.
Ownership History
Date
Name
Owned For
Owner Type
Purchase Details
Closed on
May 29, 2002
Sold by
Sander Donald L and Sander Bonnie L
Bought by
Ward Donald S and Sander Christine S
Current Estimated Value
Purchase Details
Closed on
May 28, 1999
Sold by
Palmer Mary J and Huffman Mary Jane
Bought by
Sander Donald L and Sander Bonnie L
Home Financials for this Owner
Home Financials are based on the most recent Mortgage that was taken out on this home.
Original Mortgage
$60,000
Interest Rate
6.58%
Purchase Details
Closed on
Oct 12, 1982
Sold by
Dennis M Palmer
Bought by
Palmer Mary J
Purchase Details
Closed on
Oct 20, 1978
Sold by
Palmer Dennis M
Bought by
Dennis M Palmer
Purchase Details
Closed on
Jul 6, 1976
Bought by
Palmer Dennis M
Purchase Details
Closed on
Mar 2, 1976
Bought by
Production Homes Inc
Purchase Details
Closed on
Jan 1, 1976
Bought by
North East Land Co
Create a Home Valuation Report for This Property
The Home Valuation Report is an in-depth analysis detailing your home's value as well as a comparison with similar homes in the area
Home Values in the Area
Average Home Value in this Area
Purchase History
| Date | Buyer | Sale Price | Title Company |
|---|---|---|---|
| Ward Donald S | $185,000 | Westpoint Title Agency | |
| Sander Donald L | $179,900 | -- | |
| Palmer Mary J | -- | -- | |
| Dennis M Palmer | -- | -- | |
| Palmer Dennis M | $67,000 | -- | |
| Production Homes Inc | $15,000 | -- | |
| North East Land Co | -- | -- |
Source: Public Records
Mortgage History
| Date | Status | Borrower | Loan Amount |
|---|---|---|---|
| Previous Owner | Sander Donald L | $60,000 |
Source: Public Records
Tax History Compared to Growth
Tax History
| Year | Tax Paid | Tax Assessment Tax Assessment Total Assessment is a certain percentage of the fair market value that is determined by local assessors to be the total taxable value of land and additions on the property. | Land | Improvement |
|---|---|---|---|---|
| 2024 | $5,344 | $113,820 | $22,785 | $91,035 |
| 2023 | $5,238 | $83,660 | $19,290 | $64,370 |
| 2022 | $5,200 | $83,650 | $19,290 | $64,370 |
| 2021 | $5,159 | $83,650 | $19,290 | $64,370 |
| 2020 | $4,780 | $68,570 | $15,820 | $52,750 |
| 2019 | $4,640 | $195,900 | $45,200 | $150,700 |
| 2018 | $4,211 | $68,570 | $15,820 | $52,750 |
| 2017 | $4,222 | $63,640 | $12,780 | $50,860 |
| 2016 | $4,187 | $63,640 | $12,780 | $50,860 |
| 2015 | $4,247 | $63,640 | $12,780 | $50,860 |
| 2014 | $4,247 | $63,640 | $12,780 | $50,860 |
Source: Public Records
Map
Nearby Homes
- 17024 Bear Creek Ln
- 18294 Drake Rd
- 17682 Drake Rd
- 17934 Cambridge Oval
- 18162 Fawn Cir
- 17159 Turkey Meadow Ln
- 18411 Yorktown Oval
- 17259 Woodshire Dr
- 19297 Lauren Way
- 19311 Bradford Ct
- 16650 Lanier Ave
- 18630 Shurmer Rd
- 16486 S Red Rock Dr
- 20393 Wildwood Ln
- 18848 Pearl Rd
- 16450 Howe Rd
- 17130 Golden Star Dr
- 19908 Stoughton Dr
- 19513 Lunn Rd
- 20114 Drake Rd
- 17157 Rabbit Run Dr
- 16968 Stag Thicket Ln
- 17149 Rabbit Run Dr
- 16969 Stag Thicket Ln
- 16971 Stag Thicket Ln
- 17158 Rabbit Run Dr
- 16970 Stag Thicket Ln
- 16956 Deer Path Dr
- 17166 Rabbit Run Dr
- 16973 Stag Thicket Ln
- 17141 Rabbit Run Dr
- 17150 Rabbit Run Dr
- 16872 Rabbit Run Dr
- 16958 Deer Path Dr
- 16952 Stag Thicket Ln
- 16857 Rabbit Run Dr
- 17133 Rabbit Run Dr
- 16829 Wolf Run Cir
- 17142 Rabbit Run Dr
- 16960 Deer Path Dr