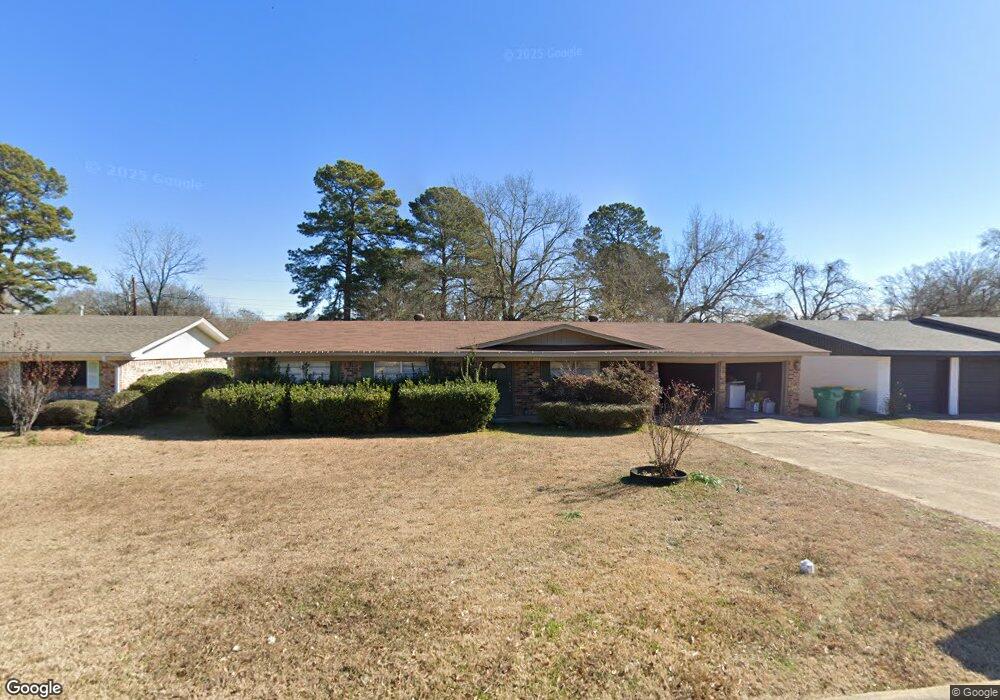
1717 Atlanta St Texarkana, TX 75501
Estimated Value: $143,000 - $181,000
--
Bed
--
Bath
2,106
Sq Ft
$77/Sq Ft
Est. Value
About This Home
This home is located at 1717 Atlanta St, Texarkana, TX 75501 and is currently estimated at $161,140, approximately $76 per square foot. 1717 Atlanta St is a home located in Bowie County with nearby schools including Liberty-Eylau Early Childhood Center, Liberty-Eylau Primary School, and Liberty-Eylau C.K. Bender Elementary Campus.
Create a Home Valuation Report for This Property
The Home Valuation Report is an in-depth analysis detailing your home's value as well as a comparison with similar homes in the area
Home Values in the Area
Average Home Value in this Area
Tax History Compared to Growth
Tax History
| Year | Tax Paid | Tax Assessment Tax Assessment Total Assessment is a certain percentage of the fair market value that is determined by local assessors to be the total taxable value of land and additions on the property. | Land | Improvement |
|---|---|---|---|---|
| 2025 | $3,336 | $163,474 | $8,500 | $154,974 |
| 2024 | $3,336 | $159,072 | $8,500 | $150,572 |
| 2023 | $3,013 | $142,498 | $7,500 | $134,998 |
| 2022 | $3,011 | $128,389 | $7,500 | $120,889 |
| 2021 | $2,657 | $106,197 | $7,500 | $98,697 |
| 2020 | $2,555 | $101,560 | $7,500 | $94,060 |
| 2019 | $2,619 | $100,241 | $7,500 | $92,741 |
| 2018 | $2,527 | $96,741 | $7,500 | $89,241 |
| 2017 | $2,475 | $95,022 | $7,500 | $87,522 |
| 2016 | $2,627 | $100,857 | $7,500 | $93,357 |
| 2015 | $2,421 | $99,954 | $7,500 | $92,454 |
| 2014 | $2,421 | $96,472 | $7,500 | $88,972 |
Source: Public Records
Map
Nearby Homes
- 1605 S Robison Rd
- 1716 S Robison Rd
- 1407 S Lake Dr
- 0 S Robison Rd
- 3610 Davis St
- 3007 Post St
- 3009 Post St
- 3305 S Lake Dr
- 0 Tbd 1 St W Unit 116362
- 0 Tbd 1 Ann St
- 1309 West St
- 3007 Hollywood St
- 1215 S Lake Dr
- 1801 S Lake Dr
- 2122 Parkham St
- 2803 Johnson Ln
- 1306 Caldwell St
- 1104 Caldwell St
- 1304 Caldwell St
- 2120 Flower Acre Rd
- 1715 Atlanta St
- 1719 Atlanta St
- LT 34 - 35 Atlanta St
- LT 34-35 Atlanta St
- 1713 Atlanta St
- 1708 Gatling St
- 1619 Atlanta St
- 1710 Gatling St
- 1706 Gatling St
- 1702 Gatling St
- 1725 Atlanta St
- 1714 Atlanta St
- 1712 Atlanta St
- 1712 Atlanta St
- 1714 Gatling St
- 1617 Atlanta St
- 1716 Gatling St
- 1713 Gatling St
- 1620 Gatling St
- 1615 Atlanta St