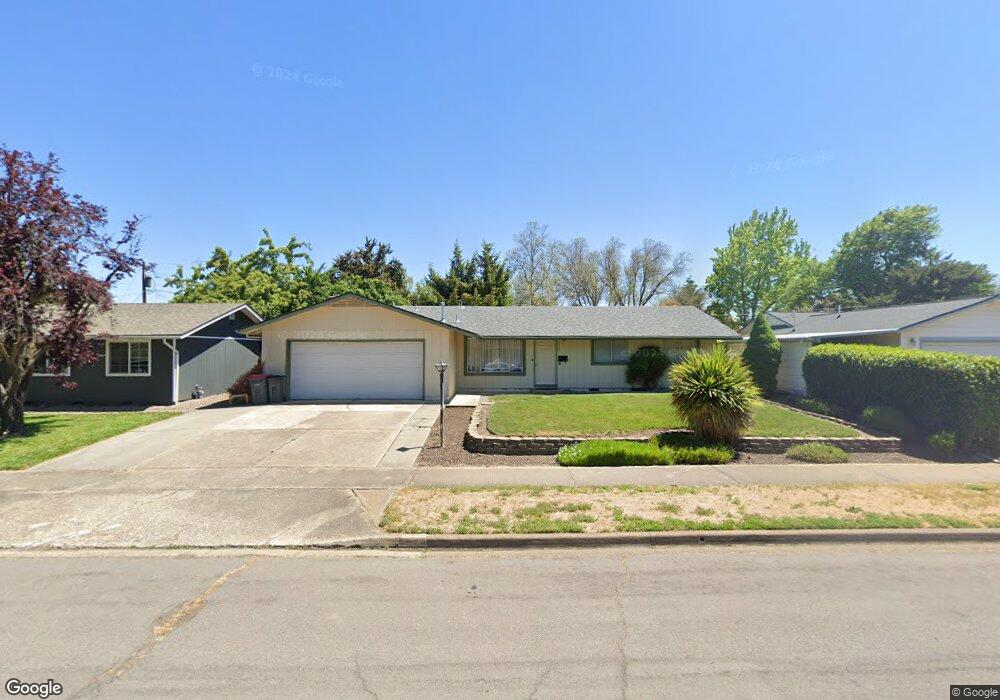
1717 Howell Ave Medford, OR 97501
Southwest Medford NeighborhoodEstimated Value: $332,000 - $379,000
3
Beds
2
Baths
1,336
Sq Ft
$270/Sq Ft
Est. Value
About This Home
This home is located at 1717 Howell Ave, Medford, OR 97501 and is currently estimated at $360,622, approximately $269 per square foot. 1717 Howell Ave is a home located in Jackson County with nearby schools including Jefferson Elementary School, McLoughlin Middle School, and South Medford High School.
Ownership History
Date
Name
Owned For
Owner Type
Purchase Details
Closed on
Sep 19, 2006
Sold by
Barden Kevin D and Barden Lisa M
Bought by
Mann Bobbie
Current Estimated Value
Home Financials for this Owner
Home Financials are based on the most recent Mortgage that was taken out on this home.
Original Mortgage
$210,000
Outstanding Balance
$130,049
Interest Rate
7.25%
Mortgage Type
Purchase Money Mortgage
Estimated Equity
$230,573
Purchase Details
Closed on
Aug 12, 2002
Sold by
Fielding Rebecca S and Fielding Paul Rebecca
Bought by
Barden Kevin D and Barden Lisa M
Home Financials for this Owner
Home Financials are based on the most recent Mortgage that was taken out on this home.
Original Mortgage
$115,875
Interest Rate
6.51%
Purchase Details
Closed on
Oct 19, 1999
Sold by
Schackwitz Linda L
Bought by
Paul Rebecca S
Home Financials for this Owner
Home Financials are based on the most recent Mortgage that was taken out on this home.
Original Mortgage
$102,343
Interest Rate
7.86%
Mortgage Type
FHA
Create a Home Valuation Report for This Property
The Home Valuation Report is an in-depth analysis detailing your home's value as well as a comparison with similar homes in the area
Home Values in the Area
Average Home Value in this Area
Purchase History
| Date | Buyer | Sale Price | Title Company |
|---|---|---|---|
| Mann Bobbie | $210,000 | Amerititle | |
| Barden Kevin D | $128,750 | Jackson County Title | |
| Paul Rebecca S | $102,500 | Jackson County Title |
Source: Public Records
Mortgage History
| Date | Status | Borrower | Loan Amount |
|---|---|---|---|
| Open | Mann Bobbie | $210,000 | |
| Previous Owner | Barden Kevin D | $115,875 | |
| Previous Owner | Paul Rebecca S | $102,343 |
Source: Public Records
Tax History Compared to Growth
Tax History
| Year | Tax Paid | Tax Assessment Tax Assessment Total Assessment is a certain percentage of the fair market value that is determined by local assessors to be the total taxable value of land and additions on the property. | Land | Improvement |
|---|---|---|---|---|
| 2025 | $2,495 | $172,070 | $69,500 | $102,570 |
| 2024 | $2,495 | $167,060 | $67,470 | $99,590 |
| 2023 | $2,419 | $162,200 | $65,500 | $96,700 |
| 2022 | $2,360 | $162,200 | $65,500 | $96,700 |
| 2021 | $2,299 | $157,480 | $63,590 | $93,890 |
| 2020 | $2,251 | $152,900 | $61,740 | $91,160 |
| 2019 | $2,197 | $144,130 | $58,190 | $85,940 |
| 2018 | $2,141 | $139,940 | $56,500 | $83,440 |
| 2017 | $2,103 | $139,940 | $56,500 | $83,440 |
| 2016 | $2,116 | $131,920 | $53,250 | $78,670 |
| 2015 | $2,034 | $131,920 | $53,250 | $78,670 |
| 2014 | $1,999 | $124,350 | $50,190 | $74,160 |
Source: Public Records
Map
Nearby Homes
- 541 Barry Cir
- 0 Garfield St Unit 220210927
- 1687 Lillian St
- 2010 Kings Hwy
- 1826 Hart Ave
- 877 Garfield St
- 648 Nobility Dr
- 420 Garfield St
- 871 Marshall Ave
- 690 Terrazzo Way
- 719 Terrazzo Way
- 652 Terrazzo Way
- 848 Trinity Way
- 1007 Garfield St
- 1430 S Oakdale Ave
- 1010 Garfield St
- 730 Aspen St
- 657 Terrazzo Way
- 651 Terrazzo Way
- 1752 Sandpiper Dr
- 1709 Howell Ave
- 1718 Sheldon Ave
- 1710 Sheldon Ave
- 1726 Sheldon Ave
- 1733 Howell St
- 1733 Howell Ave
- 609 Souvenir St
- 1718 Howell Ave
- 601 Souvenir St
- 1734 Sheldon Ave
- 1710 Howell Ave
- 1726 Howell Ave
- 1741 Howell Ave
- 1734 Howell Ave
- 1702 Howell Ave
- 1742 Sheldon Ave
- 1742 Howell Ave
- 1749 Howell Ave
- 1717 Sheldon Ave
- 1709 Sheldon Ave