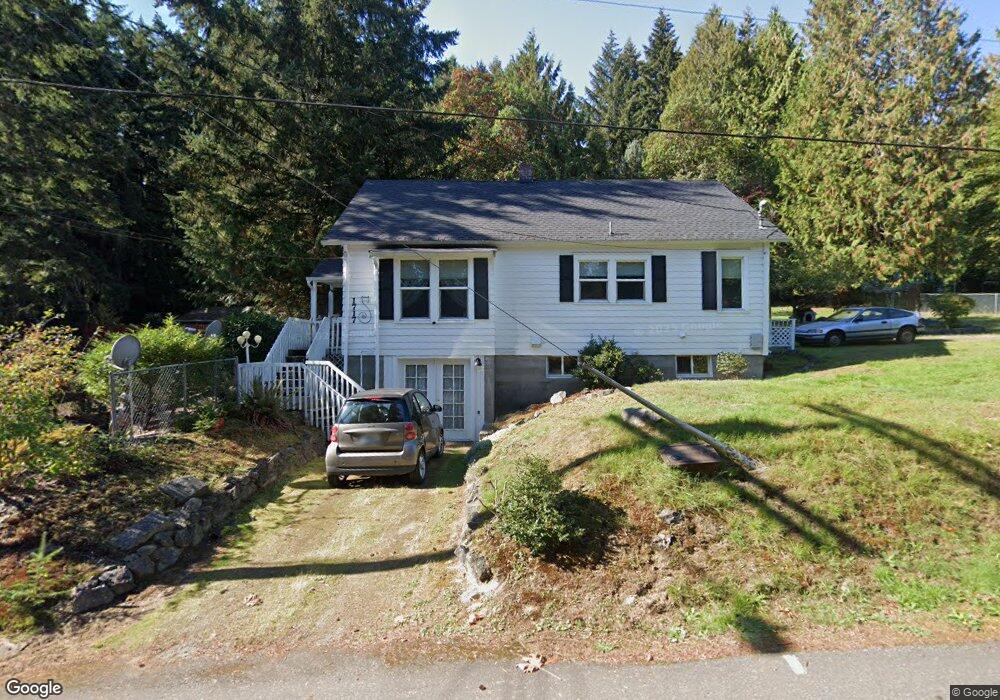
1717 Morgan Rd Bremerton, WA 98312
Rocky Point NeighborhoodEstimated Value: $414,000 - $530,000
3
Beds
1
Bath
1,458
Sq Ft
$318/Sq Ft
Est. Value
About This Home
This home is located at 1717 Morgan Rd, Bremerton, WA 98312 and is currently estimated at $464,228, approximately $318 per square foot. 1717 Morgan Rd is a home located in Kitsap County with nearby schools including Crownhill Elementary School, Mountain View Middle School, and Bremerton High School.
Ownership History
Date
Name
Owned For
Owner Type
Purchase Details
Closed on
Jul 24, 2002
Sold by
Kenney Sandra L
Bought by
Purkiss Catherine
Current Estimated Value
Home Financials for this Owner
Home Financials are based on the most recent Mortgage that was taken out on this home.
Original Mortgage
$90,000
Outstanding Balance
$37,638
Interest Rate
6.52%
Estimated Equity
$426,590
Purchase Details
Closed on
Mar 27, 2000
Sold by
Staal Darlene
Bought by
Kenney Sandra L
Home Financials for this Owner
Home Financials are based on the most recent Mortgage that was taken out on this home.
Original Mortgage
$89,991
Interest Rate
8.3%
Mortgage Type
FHA
Purchase Details
Closed on
Nov 27, 1995
Sold by
Isham Lewis E and Edminson Clarence W
Bought by
Staal Darlene and Pitts Larry
Create a Home Valuation Report for This Property
The Home Valuation Report is an in-depth analysis detailing your home's value as well as a comparison with similar homes in the area
Home Values in the Area
Average Home Value in this Area
Purchase History
| Date | Buyer | Sale Price | Title Company |
|---|---|---|---|
| Purkiss Catherine | $112,500 | Transnation Title Insurance | |
| Kenney Sandra L | $91,000 | Transnation Title Insurance | |
| Staal Darlene | $40,000 | Land Title Company |
Source: Public Records
Mortgage History
| Date | Status | Borrower | Loan Amount |
|---|---|---|---|
| Open | Purkiss Catherine | $90,000 | |
| Previous Owner | Kenney Sandra L | $89,991 |
Source: Public Records
Tax History Compared to Growth
Tax History
| Year | Tax Paid | Tax Assessment Tax Assessment Total Assessment is a certain percentage of the fair market value that is determined by local assessors to be the total taxable value of land and additions on the property. | Land | Improvement |
|---|---|---|---|---|
| 2026 | $2,069 | $423,310 | $90,490 | $332,820 |
| 2025 | $2,069 | $423,310 | $90,490 | $332,820 |
| 2024 | $4,056 | $423,310 | $90,490 | $332,820 |
| 2023 | $3,994 | $423,310 | $90,490 | $332,820 |
| 2022 | $3,709 | $353,560 | $75,410 | $278,150 |
| 2021 | $3,284 | $292,650 | $56,700 | $235,950 |
| 2020 | $3,067 | $271,850 | $52,480 | $219,370 |
| 2019 | $2,710 | $243,250 | $46,840 | $196,410 |
| 2018 | $2,680 | $161,310 | $35,220 | $126,090 |
| 2017 | $2,185 | $161,310 | $35,220 | $126,090 |
| 2016 | $2,025 | $141,760 | $30,890 | $110,870 |
| 2015 | $2,072 | $145,430 | $33,600 | $111,830 |
| 2014 | -- | $138,850 | $33,600 | $105,250 |
| 2013 | -- | $148,400 | $35,470 | $112,930 |
Source: Public Records
Map
Nearby Homes
- 3201 17th St
- 1818 Jackson Dr
- 1135 Morgan Rd NW Unit A & B
- 2117 E Phinney Bay Dr
- 4209 Kelly Rd
- 1720 N Wycoff Ave
- 2115 Rocky Point Rd NW Unit 26
- 2115 Rocky Point Rd NW Unit 22B
- 2115 Rocky Point Rd NW Unit 6
- 1551 N Callow Ave
- 2010 Shamrock Dr NW
- 1309 Times Ave
- 1303 Times Ave
- 2415 Rocky Point Rd NW
- 931 Oyster Bay Ct
- 1146 N Callow Ave
- 2150 N Callow Ave
- 0 NW Shaw Island Way Unit NWM2369280
- 923 Pershing Ave Unit 205
- 921 Pershing Ave Unit 203
- 3515 NW 18th St
- 1715 Morgan Rd
- 1711 Morgan Rd
- 1701 Morgan Rd NW
- 1701 Morgan Rd
- 1716 Bertha Ave
- 1730 Bertha Ave NW
- 1716 Bertha Ave NW
- 1537 Morgan Rd NW
- 1537 Morgan Rd
- 1706 Bertha Ave
- 1618 Morgan Rd NW
- 1618 Morgan Rd NW
- 1706 Bertha Ave NW
- 1533 Morgan Rd
- 1542 Bertha Ave
- 1729 Bertha Ave
- 3703 NW 18th St
- 1727 Bertha Ave NW