Estimated Value: $563,000 - $660,000
3
Beds
2
Baths
2,896
Sq Ft
$208/Sq Ft
Est. Value
About This Home
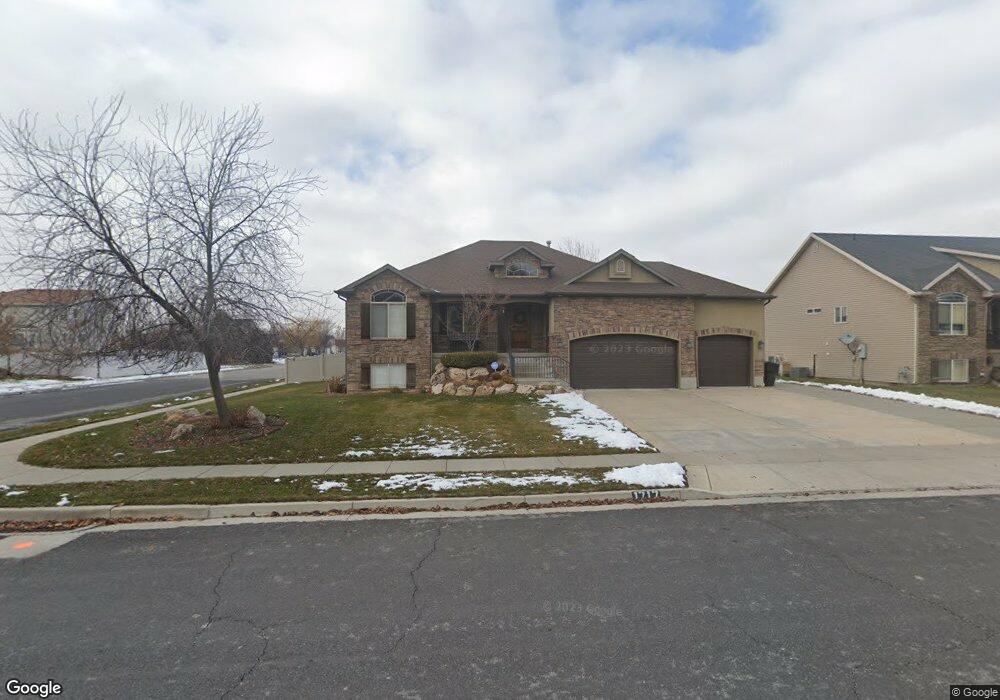
This home is located at 1717 N 200 W Unit 13, Ogden, UT 84414 and is currently estimated at $603,138, approximately $208 per square foot. 1717 N 200 W Unit 13 is a home located in Weber County with nearby schools including Pioneer School, Orion Junior High School, and Fremont High School.
Ownership History
Date
Name
Owned For
Owner Type
Purchase Details
Closed on
Feb 25, 2025
Sold by
Strebel Coleen R
Bought by
Boutin Benjamin Joseph and Boutin Kathleen Diana
Current Estimated Value
Purchase Details
Closed on
Jun 28, 2011
Sold by
Nilson & Company Inc
Bought by
Strebel Coleen R and Strebel Jack L
Home Financials for this Owner
Home Financials are based on the most recent Mortgage that was taken out on this home.
Original Mortgage
$274,851
Interest Rate
4.25%
Mortgage Type
FHA
Purchase Details
Closed on
Jul 8, 2005
Sold by
Cbd Development Inc
Bought by
Nilson & Co Inc and Nilson Homes
Home Financials for this Owner
Home Financials are based on the most recent Mortgage that was taken out on this home.
Original Mortgage
$46,397
Interest Rate
5.58%
Mortgage Type
Purchase Money Mortgage
Create a Home Valuation Report for This Property
The Home Valuation Report is an in-depth analysis detailing your home's value as well as a comparison with similar homes in the area
Home Values in the Area
Average Home Value in this Area
Purchase History
| Date | Buyer | Sale Price | Title Company |
|---|---|---|---|
| Boutin Benjamin Joseph | -- | Stewart Title | |
| Strebel Coleen R | -- | Bonneville Superior Title Co | |
| Nilson & Co Inc | -- | Mountain View Title Ogden |
Source: Public Records
Mortgage History
| Date | Status | Borrower | Loan Amount |
|---|---|---|---|
| Previous Owner | Strebel Coleen R | $274,851 | |
| Previous Owner | Nilson & Co Inc | $46,397 |
Source: Public Records
Tax History
| Year | Tax Paid | Tax Assessment Tax Assessment Total Assessment is a certain percentage of the fair market value that is determined by local assessors to be the total taxable value of land and additions on the property. | Land | Improvement |
|---|---|---|---|---|
| 2025 | $3,764 | $570,015 | $161,244 | $408,771 |
| 2024 | $3,701 | $309,099 | $88,684 | $220,415 |
| 2023 | $3,820 | $325,600 | $88,560 | $237,040 |
| 2022 | $3,589 | $314,050 | $77,624 | $236,426 |
| 2021 | $2,953 | $439,000 | $81,058 | $357,942 |
| 2020 | $2,567 | $354,000 | $65,809 | $288,191 |
| 2019 | $2,580 | $343,000 | $60,613 | $282,387 |
| 2018 | $2,543 | $324,000 | $60,613 | $263,387 |
| 2017 | $2,365 | $283,000 | $56,691 | $226,309 |
| 2016 | $2,401 | $155,769 | $25,994 | $129,775 |
| 2015 | $2,160 | $137,793 | $25,994 | $111,799 |
| 2014 | $1,927 | $119,020 | $25,994 | $93,026 |
Source: Public Records
Map
Nearby Homes
- 247 E 1825 N Unit 11
- 247 E 1825 N Unit 7
- 247 E 1825 N Unit 5
- 180 W 1825 N
- 1743 N 400 W
- 512 W 1875 N
- 1912 N 300 W
- 1978 N 225 W Unit 72
- 248 W 1950 N
- 337 W 1925 N
- 1255 N 300 East St Unit 183
- 1249 N 300 East St Unit 184
- 247 E 1850 N Unit 4
- 247 E 1850 N Unit 10
- 247 E 1850 N Unit 2
- 315 E 1650 N Unit 124
- 315 E 1650 N Unit 125
- 315 E 1650 N Unit 127
- 263 E 1825 N Unit 79
- 265 E 1900 N
- 1717 N 200 W
- 1717 N 200 W Unit 26
- 1717 N 200 W Unit 25
- 1717 N 200 W Unit 24
- 1717 N 200 W Unit 23
- 1717 N 200 W Unit 22
- 1717 N 200 W Unit 16
- 1717 N 200 W Unit 15
- 1717 N 200 W Unit 7
- 1717 N 200 W Unit 5
- 1717 N 200 W Unit 2
- 1717 N 200 W Unit 1
- 1729 N 200 W
- 209 W 1700 N
- 1716 N 225 W
- 1728 N 225 W
- 1718 N 200 W
- 1747 N 200 W
- 1747 N 200 W Unit 6
- 1730 N 200 W
Your Personal Tour Guide
Ask me questions while you tour the home.