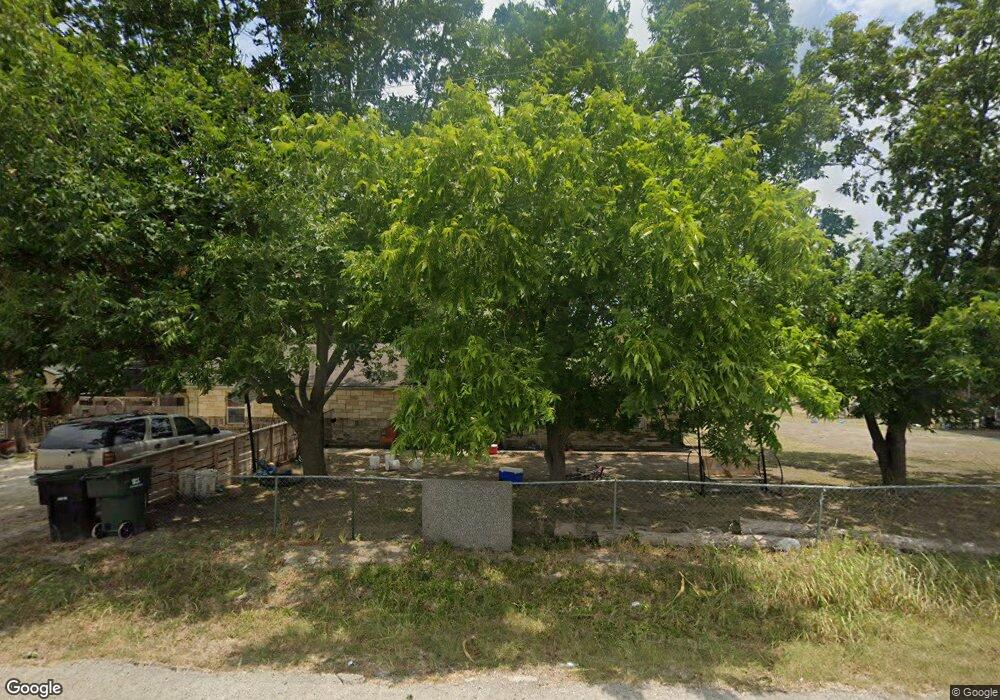
1717 N 42nd St Temple, TX 76501
Estimated Value: $269,974 - $308,000
--
Bed
2
Baths
2,025
Sq Ft
$143/Sq Ft
Est. Value
About This Home
This home is located at 1717 N 42nd St, Temple, TX 76501 and is currently estimated at $288,994, approximately $142 per square foot. 1717 N 42nd St is a home located in Bell County with nearby schools including Hector P Garcia Elementary School, Lamar Middle, and Temple High School.
Ownership History
Date
Name
Owned For
Owner Type
Purchase Details
Closed on
Jun 28, 2024
Sold by
Narvaez Luis and Vargas Sandra
Bought by
City Of Temple
Current Estimated Value
Purchase Details
Closed on
Jun 17, 2021
Sold by
Lancaster Deborah E Lammert
Bought by
Narvaez Luis
Home Financials for this Owner
Home Financials are based on the most recent Mortgage that was taken out on this home.
Original Mortgage
$78,354
Interest Rate
2.9%
Mortgage Type
Purchase Money Mortgage
Purchase Details
Closed on
Jul 30, 2007
Sold by
Brown Gary Ray
Bought by
Lancaster Deborah Elaine
Purchase Details
Closed on
May 28, 1997
Sold by
Bishop Charles G and Bishop Betty L
Bought by
Lammert Deborah E
Home Financials for this Owner
Home Financials are based on the most recent Mortgage that was taken out on this home.
Original Mortgage
$44,910
Interest Rate
8.17%
Create a Home Valuation Report for This Property
The Home Valuation Report is an in-depth analysis detailing your home's value as well as a comparison with similar homes in the area
Home Values in the Area
Average Home Value in this Area
Purchase History
| Date | Buyer | Sale Price | Title Company |
|---|---|---|---|
| City Of Temple | -- | Centraland Title | |
| Narvaez Luis | -- | None Available | |
| Lancaster Deborah Elaine | -- | None Available | |
| Lammert Deborah E | -- | -- |
Source: Public Records
Mortgage History
| Date | Status | Borrower | Loan Amount |
|---|---|---|---|
| Previous Owner | Narvaez Luis | $78,354 | |
| Previous Owner | Lammert Deborah E | $44,910 |
Source: Public Records
Tax History Compared to Growth
Tax History
| Year | Tax Paid | Tax Assessment Tax Assessment Total Assessment is a certain percentage of the fair market value that is determined by local assessors to be the total taxable value of land and additions on the property. | Land | Improvement |
|---|---|---|---|---|
| 2025 | $4,025 | $265,271 | -- | -- |
| 2024 | $4,025 | $241,155 | -- | -- |
| 2023 | $5,026 | $219,232 | $55,875 | $163,357 |
| 2022 | $4,922 | $205,566 | $47,063 | $158,503 |
| 2021 | $3,195 | $158,612 | $47,063 | $111,549 |
| 2020 | $3,037 | $156,860 | $47,063 | $109,797 |
| 2019 | $2,812 | $102,907 | $14,906 | $94,101 |
| 2018 | $2,579 | $93,552 | $8,813 | $84,739 |
| 2017 | $2,549 | $93,086 | $8,813 | $84,273 |
| 2016 | $2,413 | $88,132 | $8,813 | $79,319 |
| 2015 | $1,909 | $86,630 | $8,813 | $77,817 |
| 2014 | $1,909 | $85,477 | $0 | $0 |
Source: Public Records
Map
Nearby Homes
- 2235 Turmeric Ct
- Trinity Plan at Oak Ridge
- Medina Plan at Oak Ridge
- Lampasas Plan at Oak Ridge
- Blanco Plan at Oak Ridge
- 1110 N 42nd St
- 1109 Peppermint Dr
- 1108 Peppermint Dr
- 1205 Peppermint Dr
- 1204 Peppermint Dr
- 1201 Peppermint Dr
- 1208 Peppermint Dr
- 1105 Peppermint Dr
- 1020 Peppermint Dr
- 1423 Coriander Rd
- 2317 Saffron Rd
- Bellvue Plan at Oak Ridge
- 2227 Turmeric Ct
- 2314 Saffron Rd
- Texas Cali Plan at Oak Ridge
- 1702 N 42nd St
- 1002, 1004 N 42nd St
- 2121 Wahle Ln
- 1801 Hillcrest Rd
- 1308 Peppermint Dr
- 1305 Peppermint Dr
- 1607 Hillcrest Rd
- 1950 E French Ave
- 2222 Wahle Ln
- 1206 Cilantro Rd
- 2202 Wasabi Rd Unit ID1062679P
- 2202 Wasabi Rd Unit ID1043084P
- 2202 Wasabi Rd Unit ID1046980P
- 2202 Wasabi Rd
- 1110 & 1012 N 42nd St
- 2206 Wasabi Rd
- 2206 Wasabi Rd Unit ID1043120P
- 2210 Wasabi Rd
- 2214 Wasabi Rd
- 1925 E French Ave